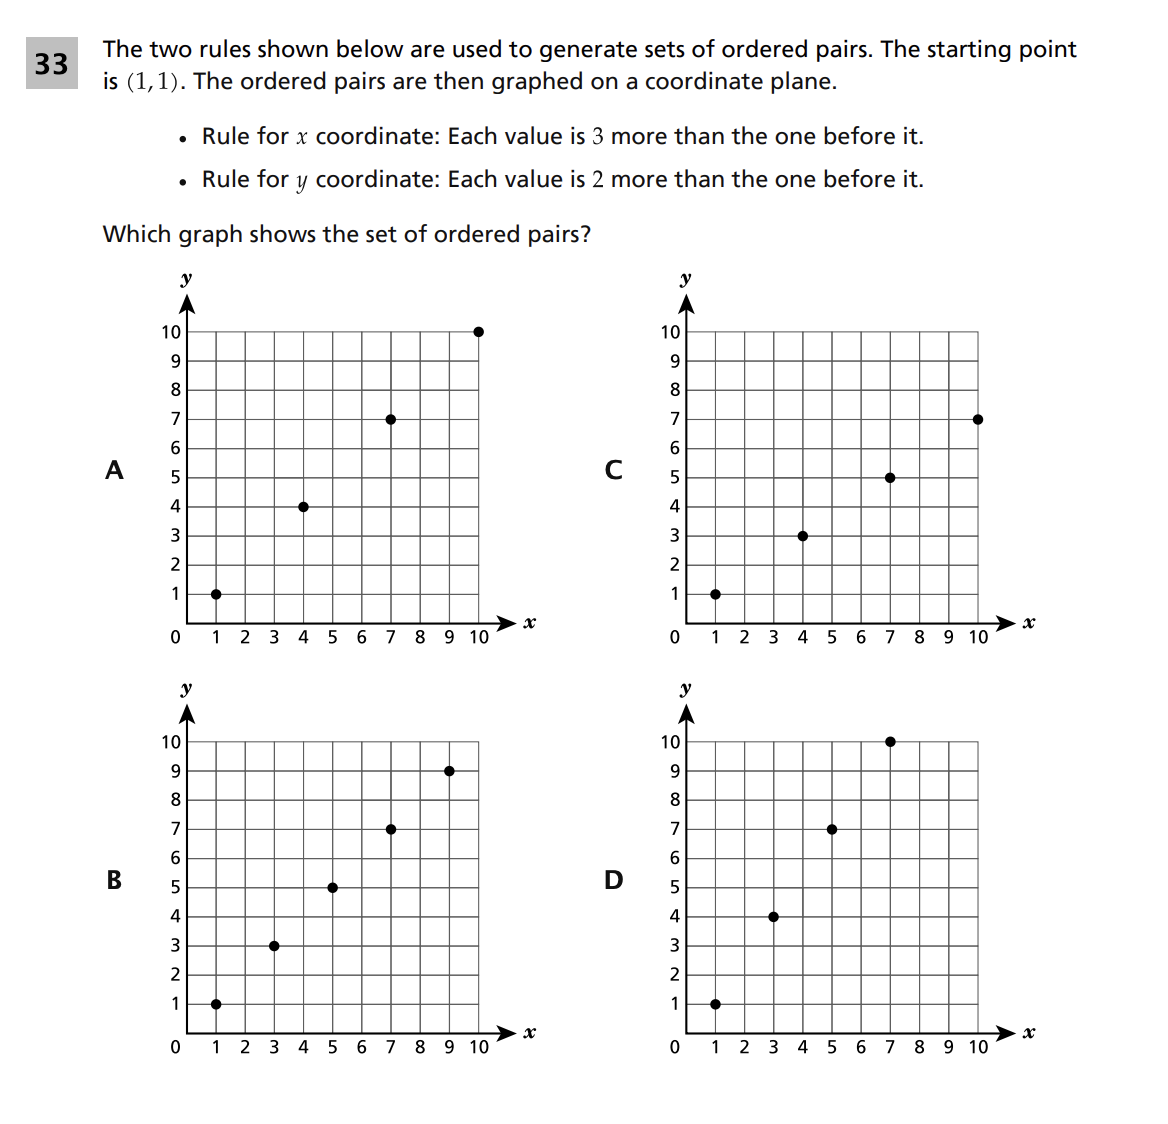
The two rules shown below are used to generate sets of ordered pairs. The starting point is (1,1). The ordered pairs are then graphed on a coordinate plane.
- Rule for x coordinate: Each value is 3 more than the one before it.
- Rule for y coordinate: Each value is 2 more than the one before it.
Which graph shows the set of ordered pairs?
A [Graph showing points (1,1), (4,4), (7,7), (10,10)]
B [Graph showing points (1,1), (3,3), (5,5), (7,7), (9,9)]
C [Graph showing points (1,1), (4,3), (7,5), (10,7)]
D [Graph showing points (1,1), (3,4), (5,7), (7,10)]
Image Description: Four coordinate plane options (A, B, C, D) are provided, each displaying the first quadrant with x and y axes ranging from 0 to 10.
- Graph A plots points that increase by 3 on x and 3 on y: (1,1), (4,4), (7,7), (10,10).
- Graph B plots points that increase by 2 on x and 2 on y: (1,1), (3,3), (5,5), (7,7), (9,9).
- Graph C plots points starting at (1,1). The next point is at x=4 (1+3) and y=3 (1+2). The subsequent point is at x=7 and y=5. The final point is at x=10 and y=7.
- Graph D plots points starting at (1,1). The next point is at x=3 and y=4. The subsequent point is at x=5 and y=7. The final point is at x=7 and y=10.