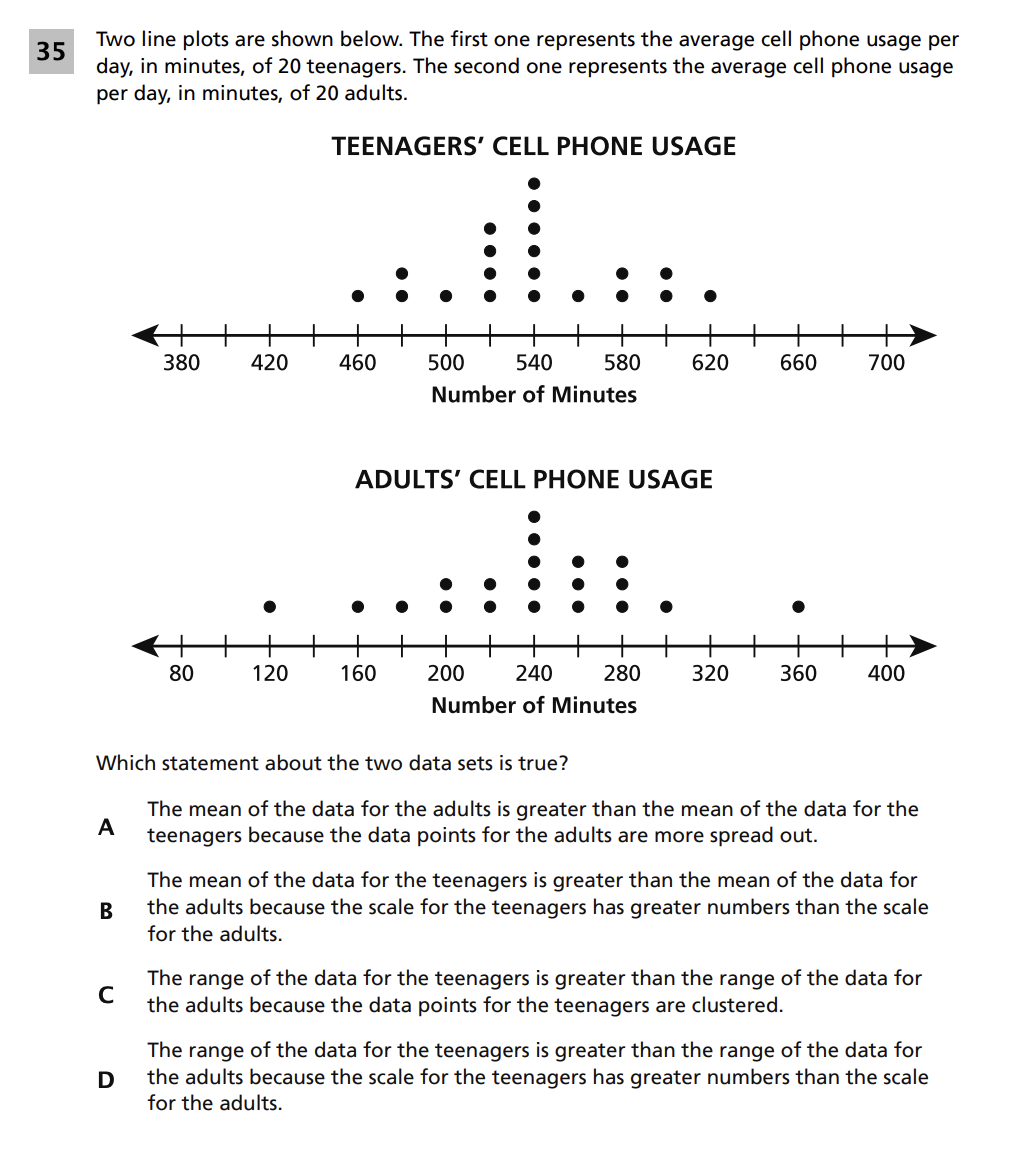
Two line plots are shown below. The first one represents the average cell phone usage per day, in minutes, of 20 teenagers. The second one represents the average cell phone usage per day, in minutes, of 20 adults.
TEENAGERS' CELL PHONE USAGE
Image Description: A dot plot on a number line labeled "Number of Minutes" from 380 to 700, in increments of 20. Dots are placed at: 460 (1 dot), 480 (2 dots), 500 (1 dot), 520 (4 dots), 540 (6 dots), 560 (1 dot), 580 (2 dots), 600 (2 dots), 620 (1 dot).
ADULTS' CELL PHONE USAGE
Image Description: A dot plot on a number line labeled "Number of Minutes" from 80 to 400, in increments of 20. Dots are placed at: 120 (1 dot), 160 (1 dot), 180 (1 dot), 200 (2 dots), 220 (2 dots), 240 (5 dots), 260 (3 dots), 280 (3 dots), 300 (1 dot), 360 (1 dot).
Which statement about the two data sets is true?
A. The mean of the data for the adults is greater than the mean of the data for the teenagers because the data points for the adults are more spread out.
B. The mean of the data for the teenagers is greater than the mean of the data for the adults because the scale for the teenagers has greater numbers than the scale for the adults.
C. The range of the data for the teenagers is greater than the range of the data for the adults because the data points for the teenagers are clustered.
D. The range of the data for the teenagers is greater than the range of the data for the adults because the scale for the teenagers has greater numbers than the scale for the adults.