2.
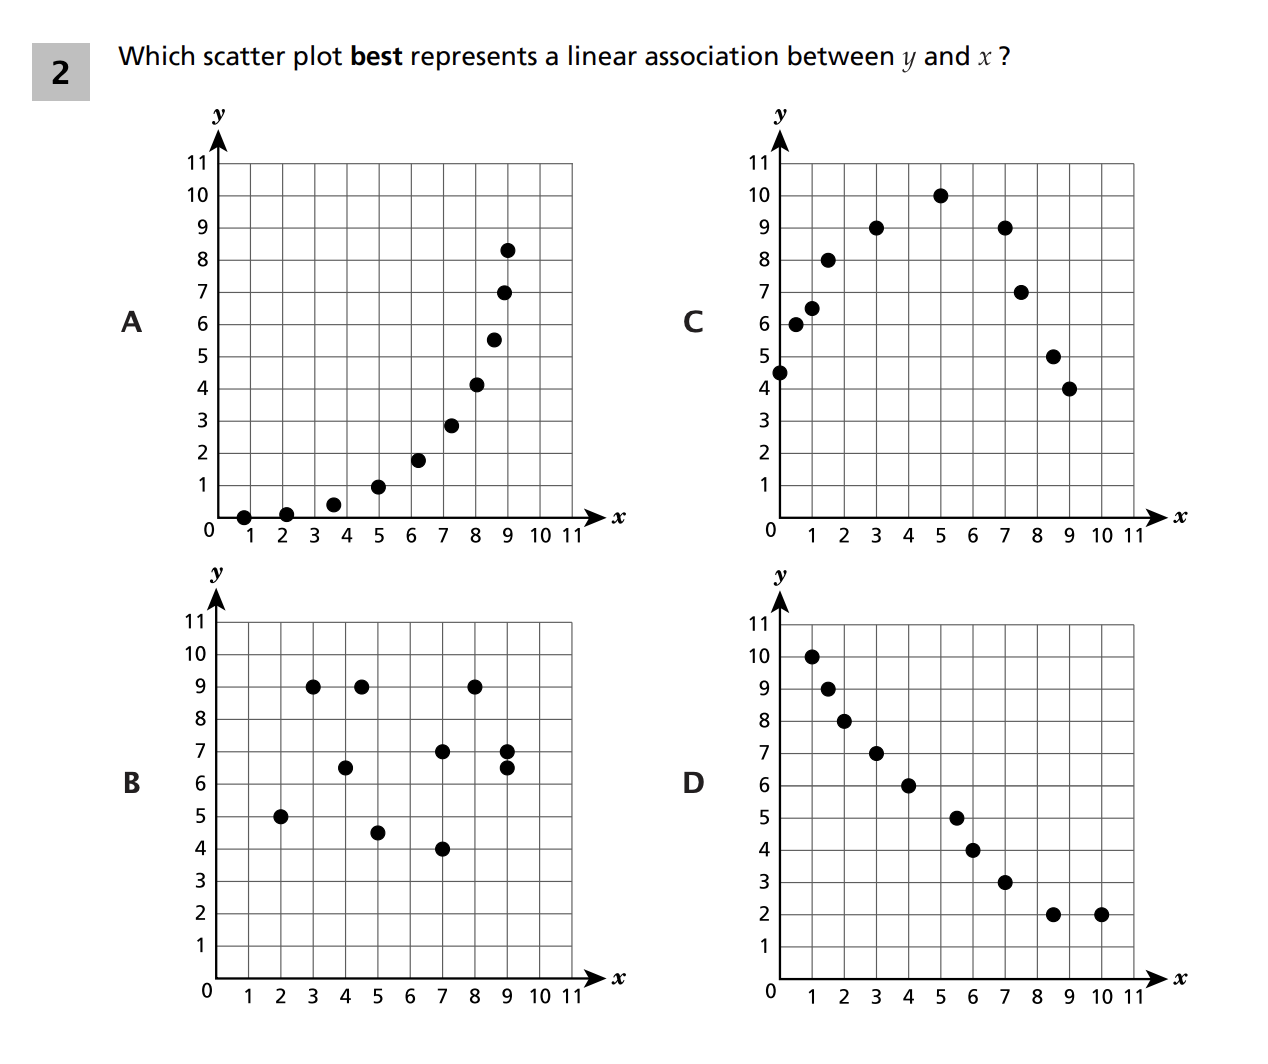
Which scatter plot best represents a linear association between y and x?
A [Graph with points curving upwards]
B [Graph with points scattered randomly]
C [Graph with points forming a U-shape parabola opening downwards]
D [Graph with points trending downwards in a straight line]
Image Description: Four scatter plots are shown.
- Graph A shows points starting low and curving steeply upward, resembling an exponential curve.
- Graph B shows points scattered randomly with no clear pattern or correlation.
- Graph C shows points increasing then decreasing, forming an inverted U-shape.
- Graph D shows points steadily decreasing as x increases, forming a clear downward linear trend.
Task Image
Standard
NGLS.Math.Content.NY-8.SP.1
Domain
Statistics and Probability