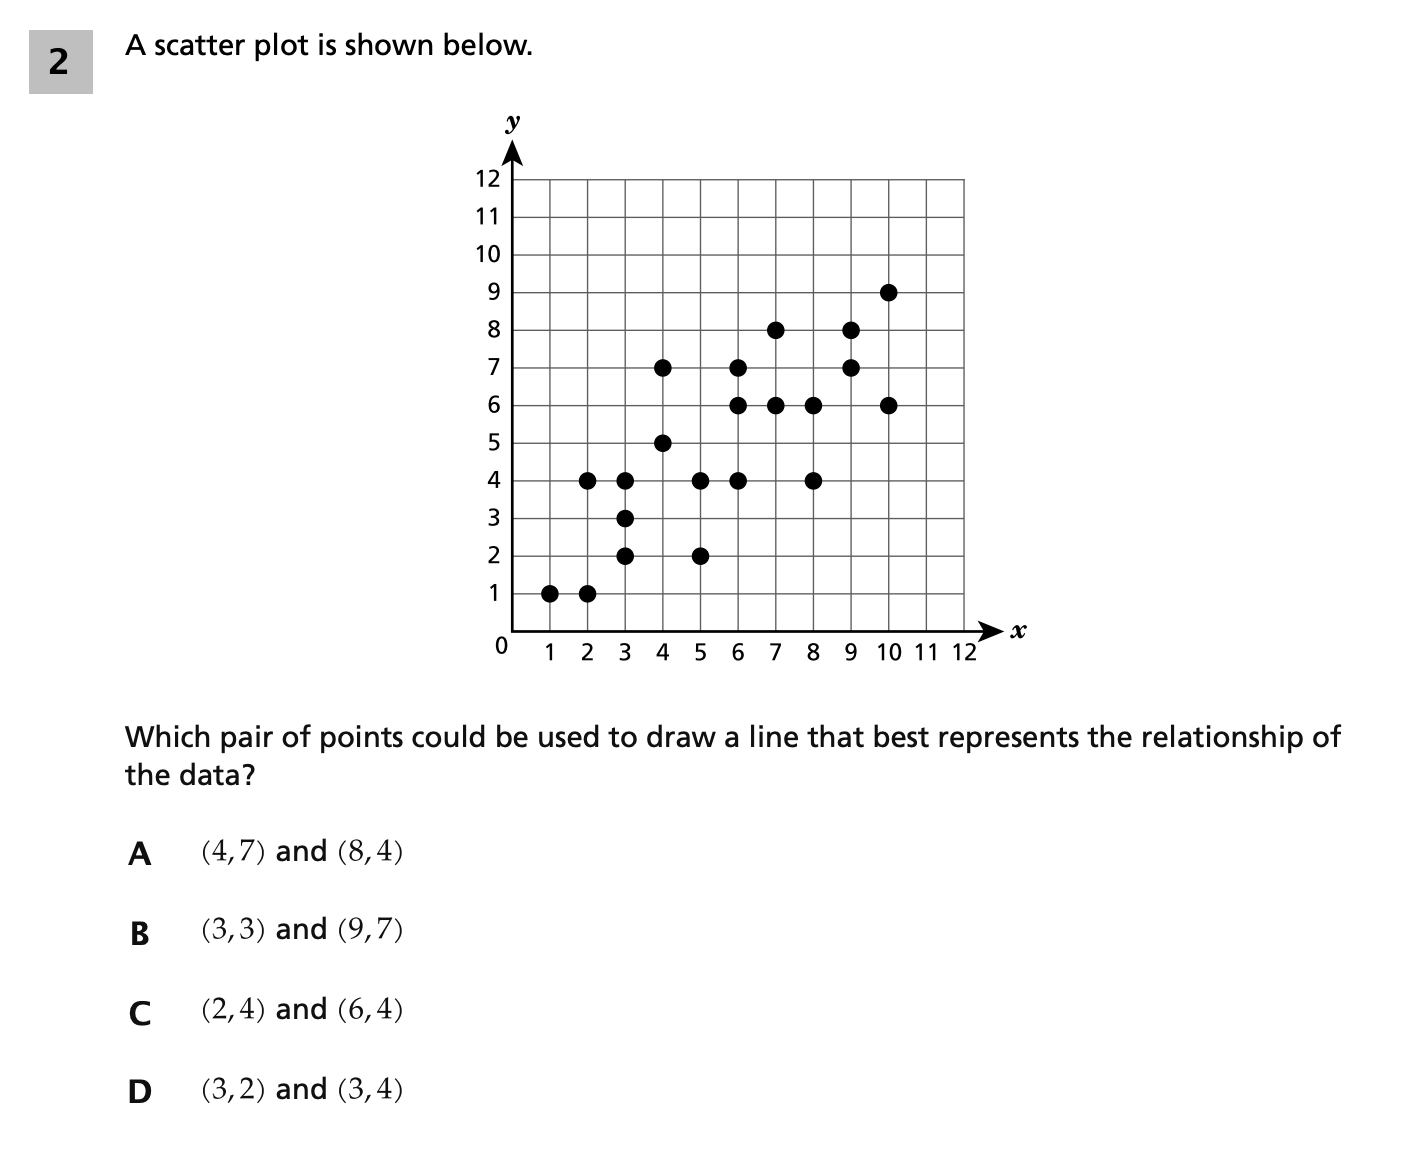
A scatter plot is shown below.
Image Description: A scatter plot on a coordinate plane with the x-axis from 0 to 12 and the y-axis from 0 to 12. Points are plotted at approximately: (1,1), (2,1), (3,2), (3,3), (3,5), (4,4), (4,4), (4,7), (5,2), (5,4), (5,4), (6,6), (6,6), (6,7), (7,6), (7,8), (7,8), (8,4), (8,6), (8,8), (9,7), (10,6), (10,9). The data shows a positive linear trend.
Which pair of points could be used to draw a line that best represents the relationship of the data?
A. (4,7) and (8,4)
B. (3,3) and (9,7)
C. (2,4) and (6,4)
D. (3,2) and (3,4)