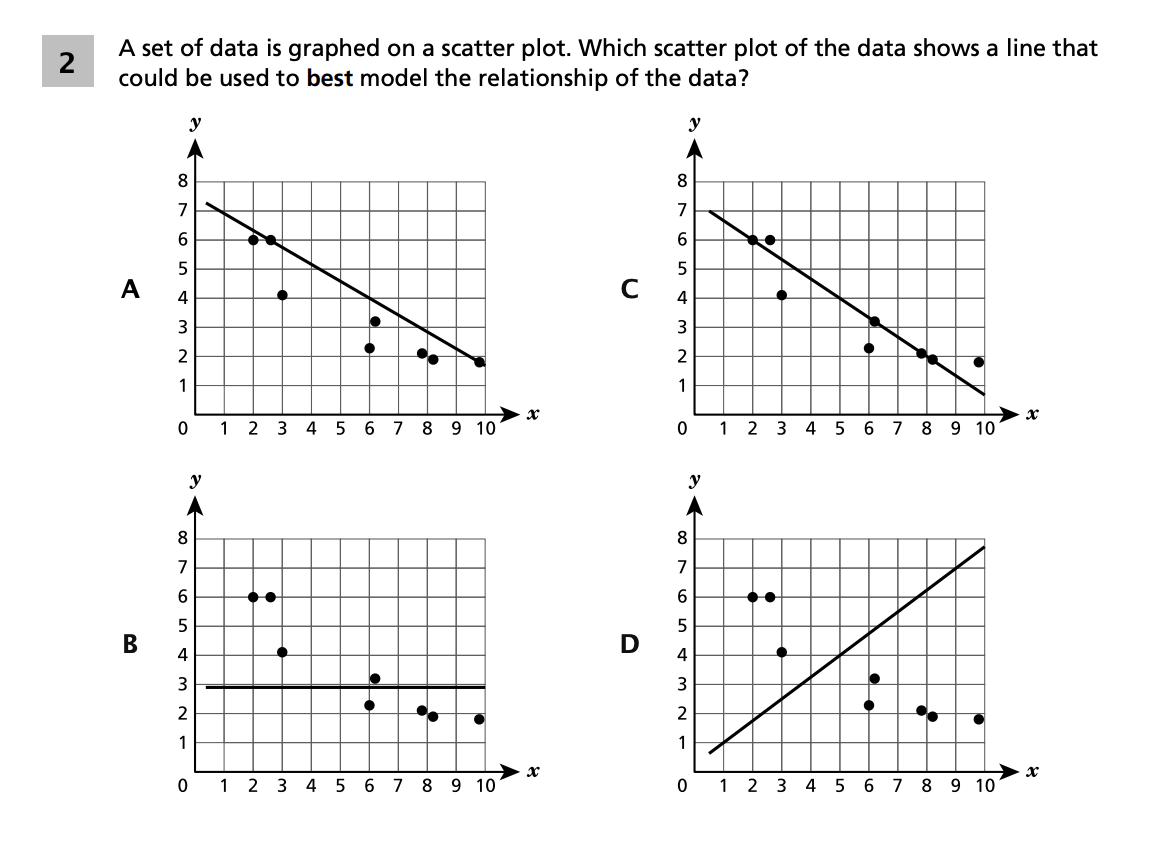
A set of data is graphed on a scatter plot. Which scatter plot of the data shows a line that could be used to best model the relationship of the data?
A. [Image Description: A scatter plot with the -axis from to and the -axis from to . Data points are scattered showing a general downward trend from left to right. A line with a steep negative slope is drawn through the data, declining sharply from the upper-left to the lower-right.]
B. [Image Description: A scatter plot with the same data points as in option A. A roughly horizontal line is drawn through the data, suggesting little to no relationship between and .]
C. [Image Description: A scatter plot with the same data points as in option A. A line with a moderate negative slope is drawn through the center of the data, closely following the general downward trend of the points.]
D. [Image Description: A scatter plot with the same data points as in option A. A line with a positive slope is drawn through the data, suggesting an upward trend from left to right, which contradicts the downward pattern of the data points.]