Unit 4 Linear Inequalities And Systems — Unit Plan
| Title | Takeaways | Student Summary | Mastery Check | Regents |
|---|---|---|---|---|
Lesson 1 Representing Situations with Inequalities A-CED.3Represent constraints by equations or inequalities, and by systems of equations and/or inequalities, and interpret solutions as viable or non-viable options in a modeling context. | — | We have used equations and the equal sign to represent relationships and constraints in various situations. Not all relationships and constraints involve equality, however. In some situations, one quantity is, or needs to be, greater than or less than another. To describe these situations, we can use inequalities and symbols such as , or . When working with inequalities, it helps to remember what the symbol means, in words. For example:
These inequalities are fairly straightforward. Each inequality states the relationship between two numbers (), or it describes the limit or boundary of a quantity in terms of a number (100<a></a></span>). </p> <p>Inequalities can also express relationships or constraints that are more complex. Here are some examples:</p> <div class="imgrid"> <div class="g--row"> <div class="g--column g--content g--three-fourth"> <ul> <li>The area of a rectangle, <span class="math">\(A, with a length of 4 meters and a width of meters is no more than 100 square meters.
In upcoming lessons, we’ll use inequalities to help us solve problems. | Grape Constraints (1 problem) Han has a budget of $25 to buy grapes. Write inequalities to represent the number of pounds of grapes that Han could buy in each situation:
Show SolutionSample response: Let represent the number of pounds of grapes. | june 2024 #2(2pt) june 2024 #35(6pt) january 2025 #31(4pt) august 2025 #35(6pt) january 2025 #35(6pt) june 2025 #35(6pt) |
Lesson 2 Solutions to Inequalities in One Variable A-REI.3Solve linear equations and inequalities in one variable, including equations with coefficients represented by letters. | — | The equation is an equation in one variable. Its solution is any value of that makes the equation true. Only meets that requirement, so 20 is the only solution. The inequality is an inequality in one variable. Any value of that makes the inequality true is a solution. For instance, 30 and 48 are both solutions because substituting these values for produces true inequalities. is true, as is . Because the inequality has a range of values that make it true, we sometimes refer to all the solutions as the solution set. One way to find the solutions to an inequality is by reasoning. For example, to find the solution to , we can reason that if 2 times a value is less than 8, then that value must be less than 4. So a solution to is any value of that is less than 4. Another way to find the solutions to is to solve the related equation . In this case, dividing each side of the equation by 2 gives . This point, where is 4, is the boundary of the solution to the inequality. To find out the range of values that make the inequality true, we can try values less than and greater than 4 in our inequality and see which ones make a true statement. Let's try some values less than 4:
Let's try values greater than 4:
In general, the inequality is false when is greater than or equal to 4 and true when is less than 4. We can represent the solution set to an inequality by writing an inequality, , or by graphing on a number line. The ray pointing to the left represents all values less than 4. | Seeking Solutions (1 problem) Which graph correctly shows the solution to the inequality ? Show or explain your reasoning. A B C D Show SolutionGraph C. Sample reasoning:
| june 2024 #6(2pt) august 2024 #13(2pt) august 2024 #20(2pt) june 2024 #22(2pt) june 2024 #25(2pt) january 2025 #11(2pt) june 2025 #21(2pt) january 2025 #22(2pt) august 2025 #25(2pt) june 2025 #26(2pt) january 2026 #11(2pt) january 2026 #25(2pt) |
Lesson 3 Writing and Solving Inequalities in One Variable A-CED.1Create equations and inequalities in one variable to represent a real-world context. A-CED.3Represent constraints by equations or inequalities, and by systems of equations and/or inequalities, and interpret solutions as viable or non-viable options in a modeling context. A-REI.3Solve linear equations and inequalities in one variable, including equations with coefficients represented by letters. | — | Writing and solving inequalities can help us make sense of the constraints in a situation and solve problems. Let's look at an example. Clare would like to buy a video game system that costs $130 and to have some extra money for games. She has saved $48 so far and plans on saving $5 of her allowance each week. How many weeks, , will it be until she has enough money to buy the system and have some extra money remaining? To represent the constraints, we can write . Let’s reason about the solutions:
We can also solve by writing and solving a related equation to find the boundary value for , and then determine whether the solutions are less than or greater than that value.
Sometimes the structure of an inequality can help us see whether the solutions are less than or greater than a boundary value. For example, to find the solutions to , we can solve the equation , which gives us . Then, instead of testing values on either side of 0, we could reason as follows about the inequality:
| How Many Hours of Work? (1 problem) Lin’s job pays $8.25 an hour plus $10 of transportation allowance each week. She has to work at least 5 hours a week to keep the job, and can earn up to $175 per week (including the allowance).
Show Solution
| june 2024 #2(2pt) august 2024 #4(2pt) june 2024 #6(2pt) august 2024 #13(2pt) august 2024 #20(2pt) june 2024 #22(2pt) june 2024 #25(2pt) june 2024 #35(6pt) august 2025 #2(2pt) january 2025 #11(2pt) june 2025 #17(2pt) june 2025 #21(2pt) january 2025 #22(2pt) january 2025 #23(2pt) august 2025 #25(2pt) june 2025 #26(2pt) january 2025 #31(4pt) august 2025 #32(4pt) august 2025 #35(6pt) january 2025 #35(6pt) june 2025 #35(6pt) january 2026 #11(2pt) january 2026 #25(2pt) january 2026 #30(2pt) |
Section A Check Section A Checkpoint | ||||
Lesson 4 Graphing Linear Inequalities in Two Variables (Part 1) A-REI.12Graph the solutions to a linear inequality in two variables as a half-plane (excluding the boundary in the case of a strict inequality), and graph the solution set to a system of linear inequalities in two variables as the intersection of the corresponding half-planes. | — | The equation is an equation in two variables. Its solution is any pair of and whose sum is 7. The pairs and are two examples. We can represent all the solutions to by graphing the equation on a coordinate plane. The graph is a line. All the points on the line are solutions to . The inequality is an inequality in two variables. Its solution is any pair of and whose sum is 7 or less than 7. This means it includes all the pairs that are solutions to the equation , but also many other pairs of and that add up to a value less than 7. The pairs and are two examples. On a coordinate plane, the solution to includes the line that represents . If we plot a few other pairs that make the inequality true, such as and , we see that these points fall on one side of the line. (In contrast, pairs that make the inequality false fall on the other side of the line.) We can shade that region on one side of the line to indicate that all points in it are solutions.
What about the inequality ? The solution is any pair of and whose sum is less than 7. This means pairs like and are not solutions. On a coordinate plane, the solution does not include points on the line that represent (because those points are and pairs whose sum is 7). To exclude points on that boundary line, we can use a dashed line. All points below that line are pairs that make true. The region on that side of the line can be shaded to show that it contains the solutions.
| Pick a Graph (1 problem)
Show Solution
| june 2024 #34(4pt) january 2025 #7(2pt) august 2025 #33(4pt) january 2026 #34(4pt) |
Lesson 6 Solving Problems with Inequalities in Two Variables A-REI.12Graph the solutions to a linear inequality in two variables as a half-plane (excluding the boundary in the case of a strict inequality), and graph the solution set to a system of linear inequalities in two variables as the intersection of the corresponding half-planes. A-CED.3Represent constraints by equations or inequalities, and by systems of equations and/or inequalities, and interpret solutions as viable or non-viable options in a modeling context. | — | Suppose we want to find the solution to . We can start by graphing the related equation . When identifying the solution region, it is important not to assume that the solution will be above the line because of a “>” symbol or below the line because of a “<” symbol. Instead, test the points on the line and on either side of the line, and see if they are solutions.
For , points on the line and above the line are not solutions to the inequality because the pairs make the inequality false. Points that are below the lines are solutions, so we can shade that lower region. Graphing technology can help us graph the solution to an inequality in two variables. Many graphing tools allow us to enter inequalities such as and will show the solution region, as shown here. Some tools, however, may require the inequalities to be in slope-intercept form or another form before displaying the solution region. Be sure to learn how to use the graphing technology available in your classroom.
Although graphing using technology is efficient, we still need to analyze the graph with care. Here are some things to consider:
| The Band Played On (1 problem) A band is playing at an auditorium with floor seats and balcony seats. The band wants to sell the floor tickets for $15 each and balcony tickets for $12 each. They want to make at least $3,000 in ticket sales.
Show Solution
| june 2024 #2(2pt) june 2024 #34(4pt) june 2024 #35(6pt) january 2025 #7(2pt) january 2025 #31(4pt) august 2025 #33(4pt) august 2025 #35(6pt) january 2025 #35(6pt) june 2025 #35(6pt) january 2026 #34(4pt) |
Section B Check Section B Checkpoint | ||||
Lesson 7 Solutions to Systems of Linear Inequalities in Two Variables A-REI.12Graph the solutions to a linear inequality in two variables as a half-plane (excluding the boundary in the case of a strict inequality), and graph the solution set to a system of linear inequalities in two variables as the intersection of the corresponding half-planes. A-CED.3Represent constraints by equations or inequalities, and by systems of equations and/or inequalities, and interpret solutions as viable or non-viable options in a modeling context. | — | In this lesson, two linear inequalities in two variables represent the constraints in a situation. Each pair of inequalities forms a system of inequalities. A solution to a system of inequalities is any pair that makes both inequalities true, or any pair of values that simultaneously meet both constraints in the situation. The solution to the system is often best represented by a region on a graph. Suppose there are two numbers, and , and there are two things we know about them.
We can represent these constraints with a system of inequalities.
There are many possible pairs of numbers that meet the first constraint, for example: 1 and 3, or 4 and 9. The same can be said about the second constraint, for example: 1 and 3, or 2.4 and 7.5. The pair and meets both constraints, so it is a solution to the system. The pair and meets the first constraint but not the second ( is a true statement, but is not true.) Remember that graphing is a great way to show all the possible solutions to an inequality, so let’s graph the solution region for each inequality.
Because we are looking for a pair of numbers that meet both constraints or make both inequalities true at the same time, we want to find points that are in the solution regions of both graphs. To do that, we can graph both inequalities on the same coordinate plane. The solution set to the system of inequalities is represented by the region where the two graphs overlap.
| Oh Good, Another Riddle (1 problem) Here is another riddle:
What are the two numbers?
Show Solution
| june 2024 #2(2pt) june 2024 #34(4pt) june 2024 #35(6pt) january 2025 #7(2pt) january 2025 #31(4pt) august 2025 #33(4pt) august 2025 #35(6pt) january 2025 #35(6pt) june 2025 #35(6pt) january 2026 #34(4pt) |
Lesson 9 Modeling with Systems of Inequalities in Two Variables HSN-Q.A.2No additional information available. A-REI.12Graph the solutions to a linear inequality in two variables as a half-plane (excluding the boundary in the case of a strict inequality), and graph the solution set to a system of linear inequalities in two variables as the intersection of the corresponding half-planes. A-CED.3Represent constraints by equations or inequalities, and by systems of equations and/or inequalities, and interpret solutions as viable or non-viable options in a modeling context. | — | — | No cool-down | june 2024 #2(2pt) june 2024 #34(4pt) june 2024 #35(6pt) january 2025 #7(2pt) january 2025 #31(4pt) august 2025 #33(4pt) august 2025 #35(6pt) january 2025 #35(6pt) june 2025 #35(6pt) january 2026 #34(4pt) |
Section C Check Section C Checkpoint | ||||
Unit 4 Assessment End-of-Unit Assessment Problem 1 Consider the inequality . Which value of is a solution to the inequality? A. ✓ B.
C.
D.
Show SolutionA Problem 2 The number of fish in a pond is eight more than the number of frogs. The total number of fish and frogs in the pond is at least 20. If represents the number of frogs, which inequality can be used to represent this situation? A.
B. ✓ C.
D.
Show SolutionB Problem 3 Which graph represents the solution to this system of inequalities?
A. Graph A B. Graph B ✓C. Graph C D. Graph D Show SolutionB Problem 4 Graph the solution to the inequality .
Show SolutionKey features: boundary line is dashed (strict inequality), intercepts at (0,4) and (5,0), region below the line is shaded. Problem 5 A hairstylist charges $15 for an adult haircut and $9 for a child haircut. She wants to earn at least $360 dollars and cut a maximum of 30 haircuts this week. The graphs represent the hairstylist's constraints.
List two points that could represent the numbers of adult and child haircuts that meet the hairstylist's goals. Show SolutionSample response: , . Any two points with nonnegative integer coordinates in the overlapping shaded region are acceptable. Problem 6 A jewelry artist is selling necklaces at an art fair. It costs $135 to rent a booth at the fair. The cost of materials for each necklace is $4.50. The artist is selling the necklaces at $12 each. The inequality represents the situation in which the artist makes a profit.
Show Solution
Problem 7 A student has started a lawn care business. He charges $15 per hour to mow lawns and $20 per hour for gardening. Because he is still in school, he is allowed to work for at most 20 hours per week. His goal is to make at least $300 per week.
Show Solution
Problem 8 Which graph is the solution to the inequality ? A. A. 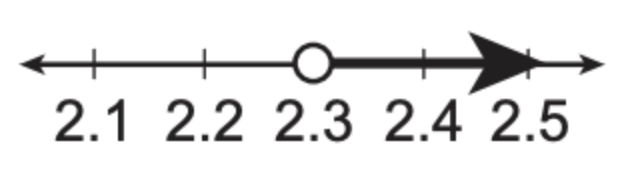 B. B. 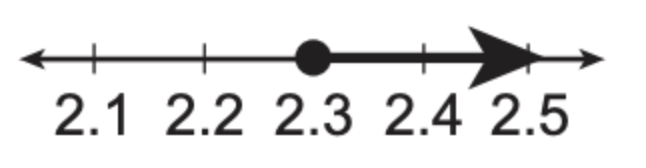 C. C. 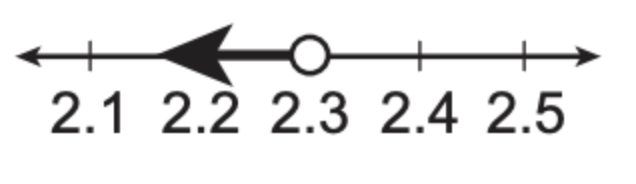 D. D. 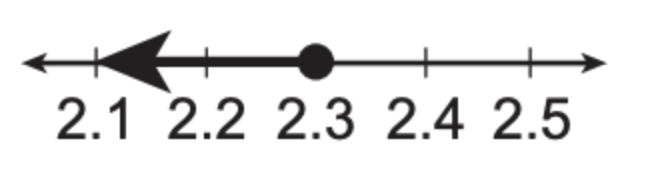 Show SolutionD Problem 9 Graph the system of inequalities on the set of axes below:
Label the solution set S. Show SolutionDashed line through and with slope 3, region above shaded. Solid line through and with slope , region below shaded. The overlapping region is labeled S. | ||||