The Correlation Coefficient
Student Summary
While residuals can help pick the best-line to fit the data among all lines, we still need a way to determine the strength of a linear relationship. Scatter plots of data that are close to the best-fit line are better modeled by the line than are scatter plots of data that are farther from the line.
The correlation coefficient is a convenient number that can be used to describe the strength and direction of a linear relationship. Usually represented by the letter r, the correlation coefficient can take values from -1 to 1. The sign of the correlation coefficient is the same as the sign of the slope for the best-fit line. The closer the correlation coefficient is to 0, the weaker the linear relationship. The closer the correlation coefficient is to 1 or -1, the better a linear model fits the data.
While it is possible to try to fit a linear model to any data, we should always look at the scatter plot to see if there is a possible linear trend. The correlation coefficient and residuals can also help determine whether the linear model makes sense to use to estimate the situation. In some cases, another type of function might be a better fit for the data, or the two variables we are examining may be uncorrelated, and we should look for connections using other variables.
Visual / Anchor Chart

Standards
HSS-ID.B.6
Represent bivariate data on a scatter plot, and describe how the variables' values are related.
HSS-ID.C.85 questions
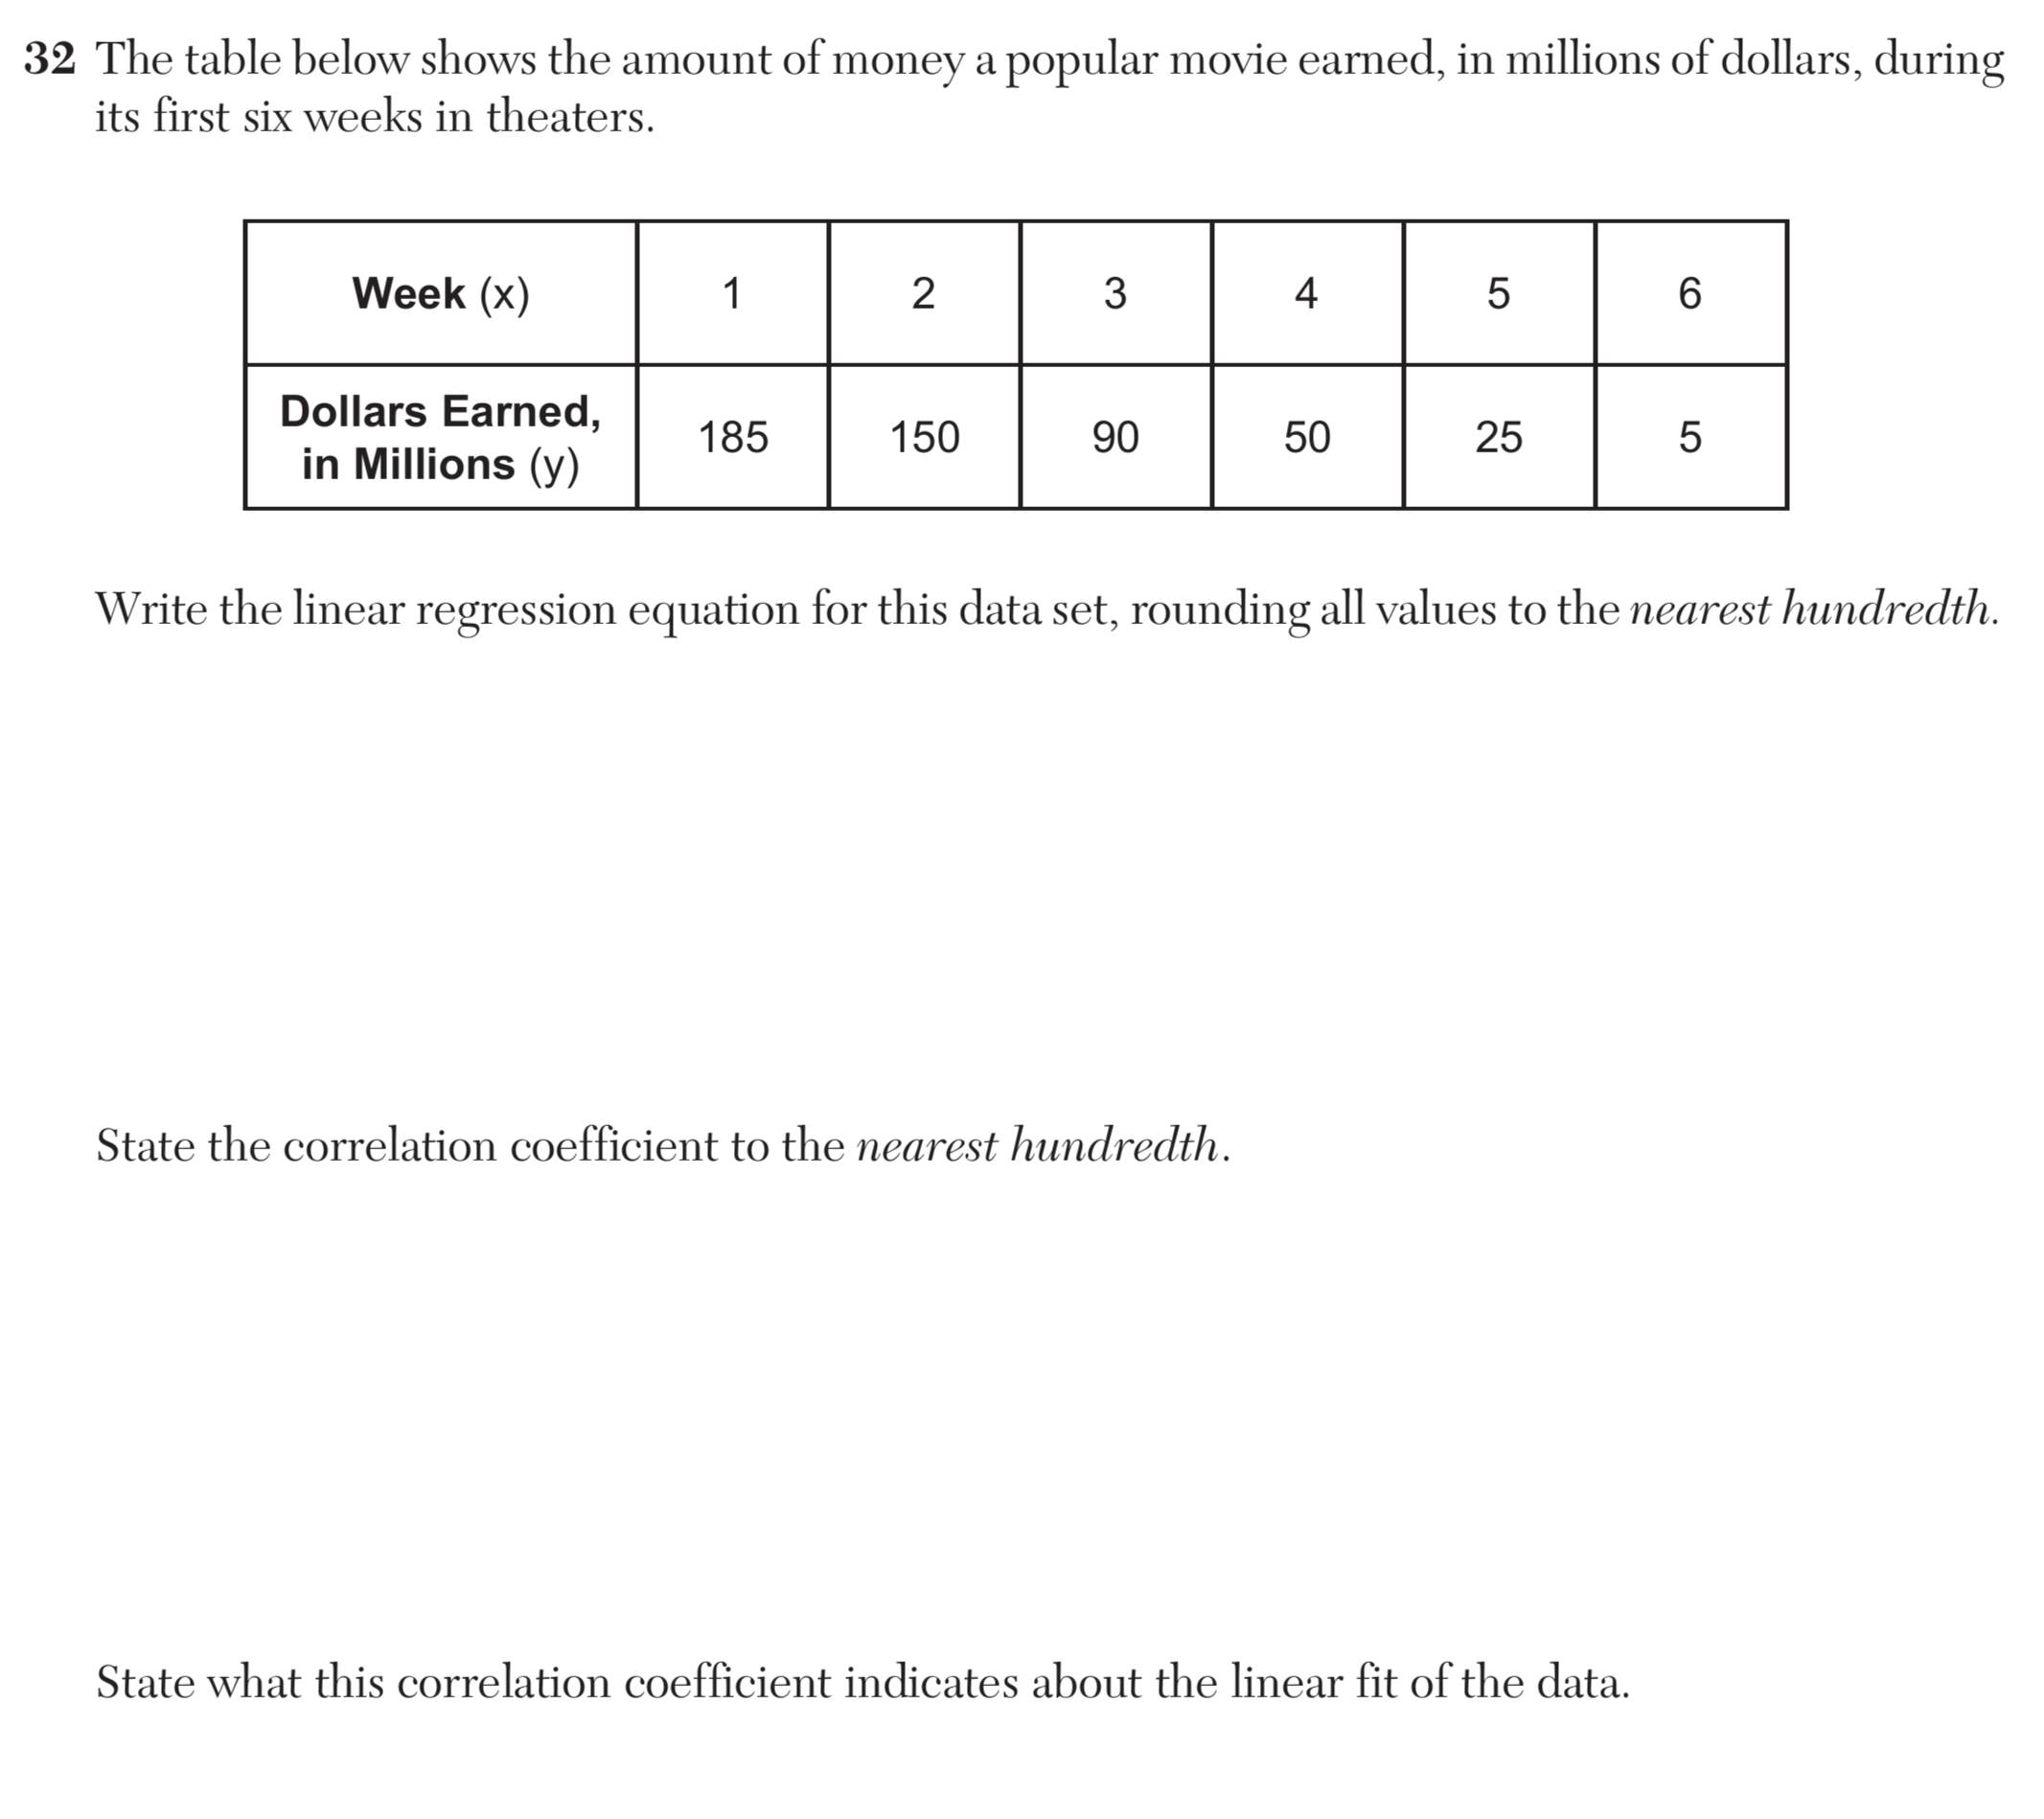
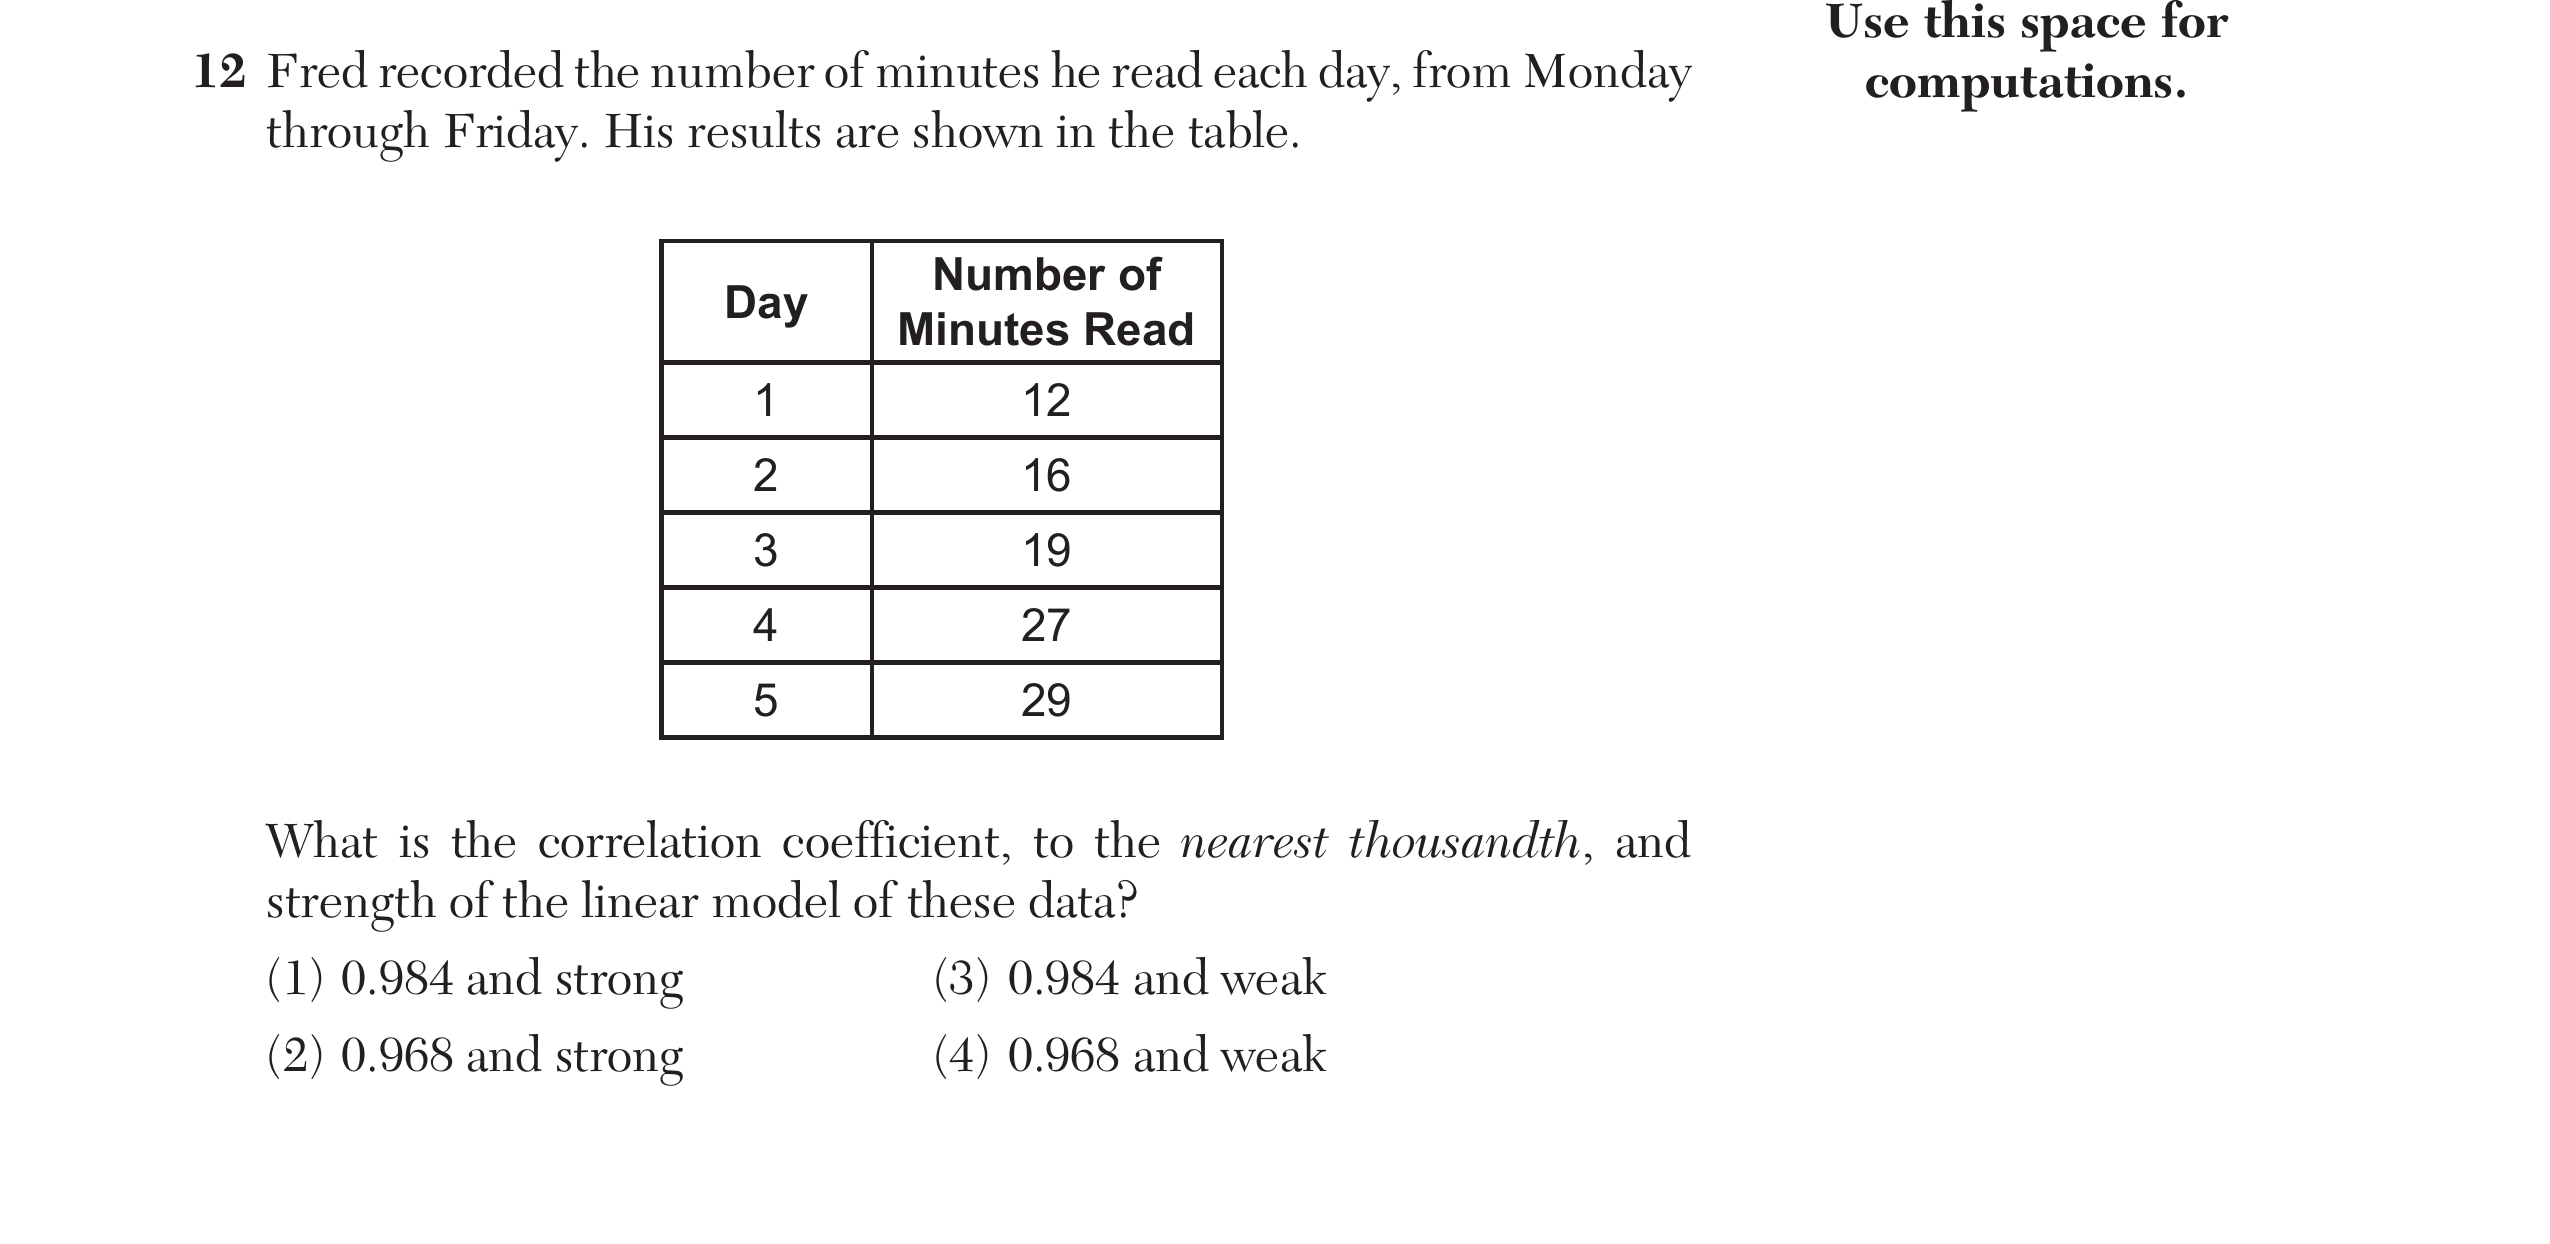
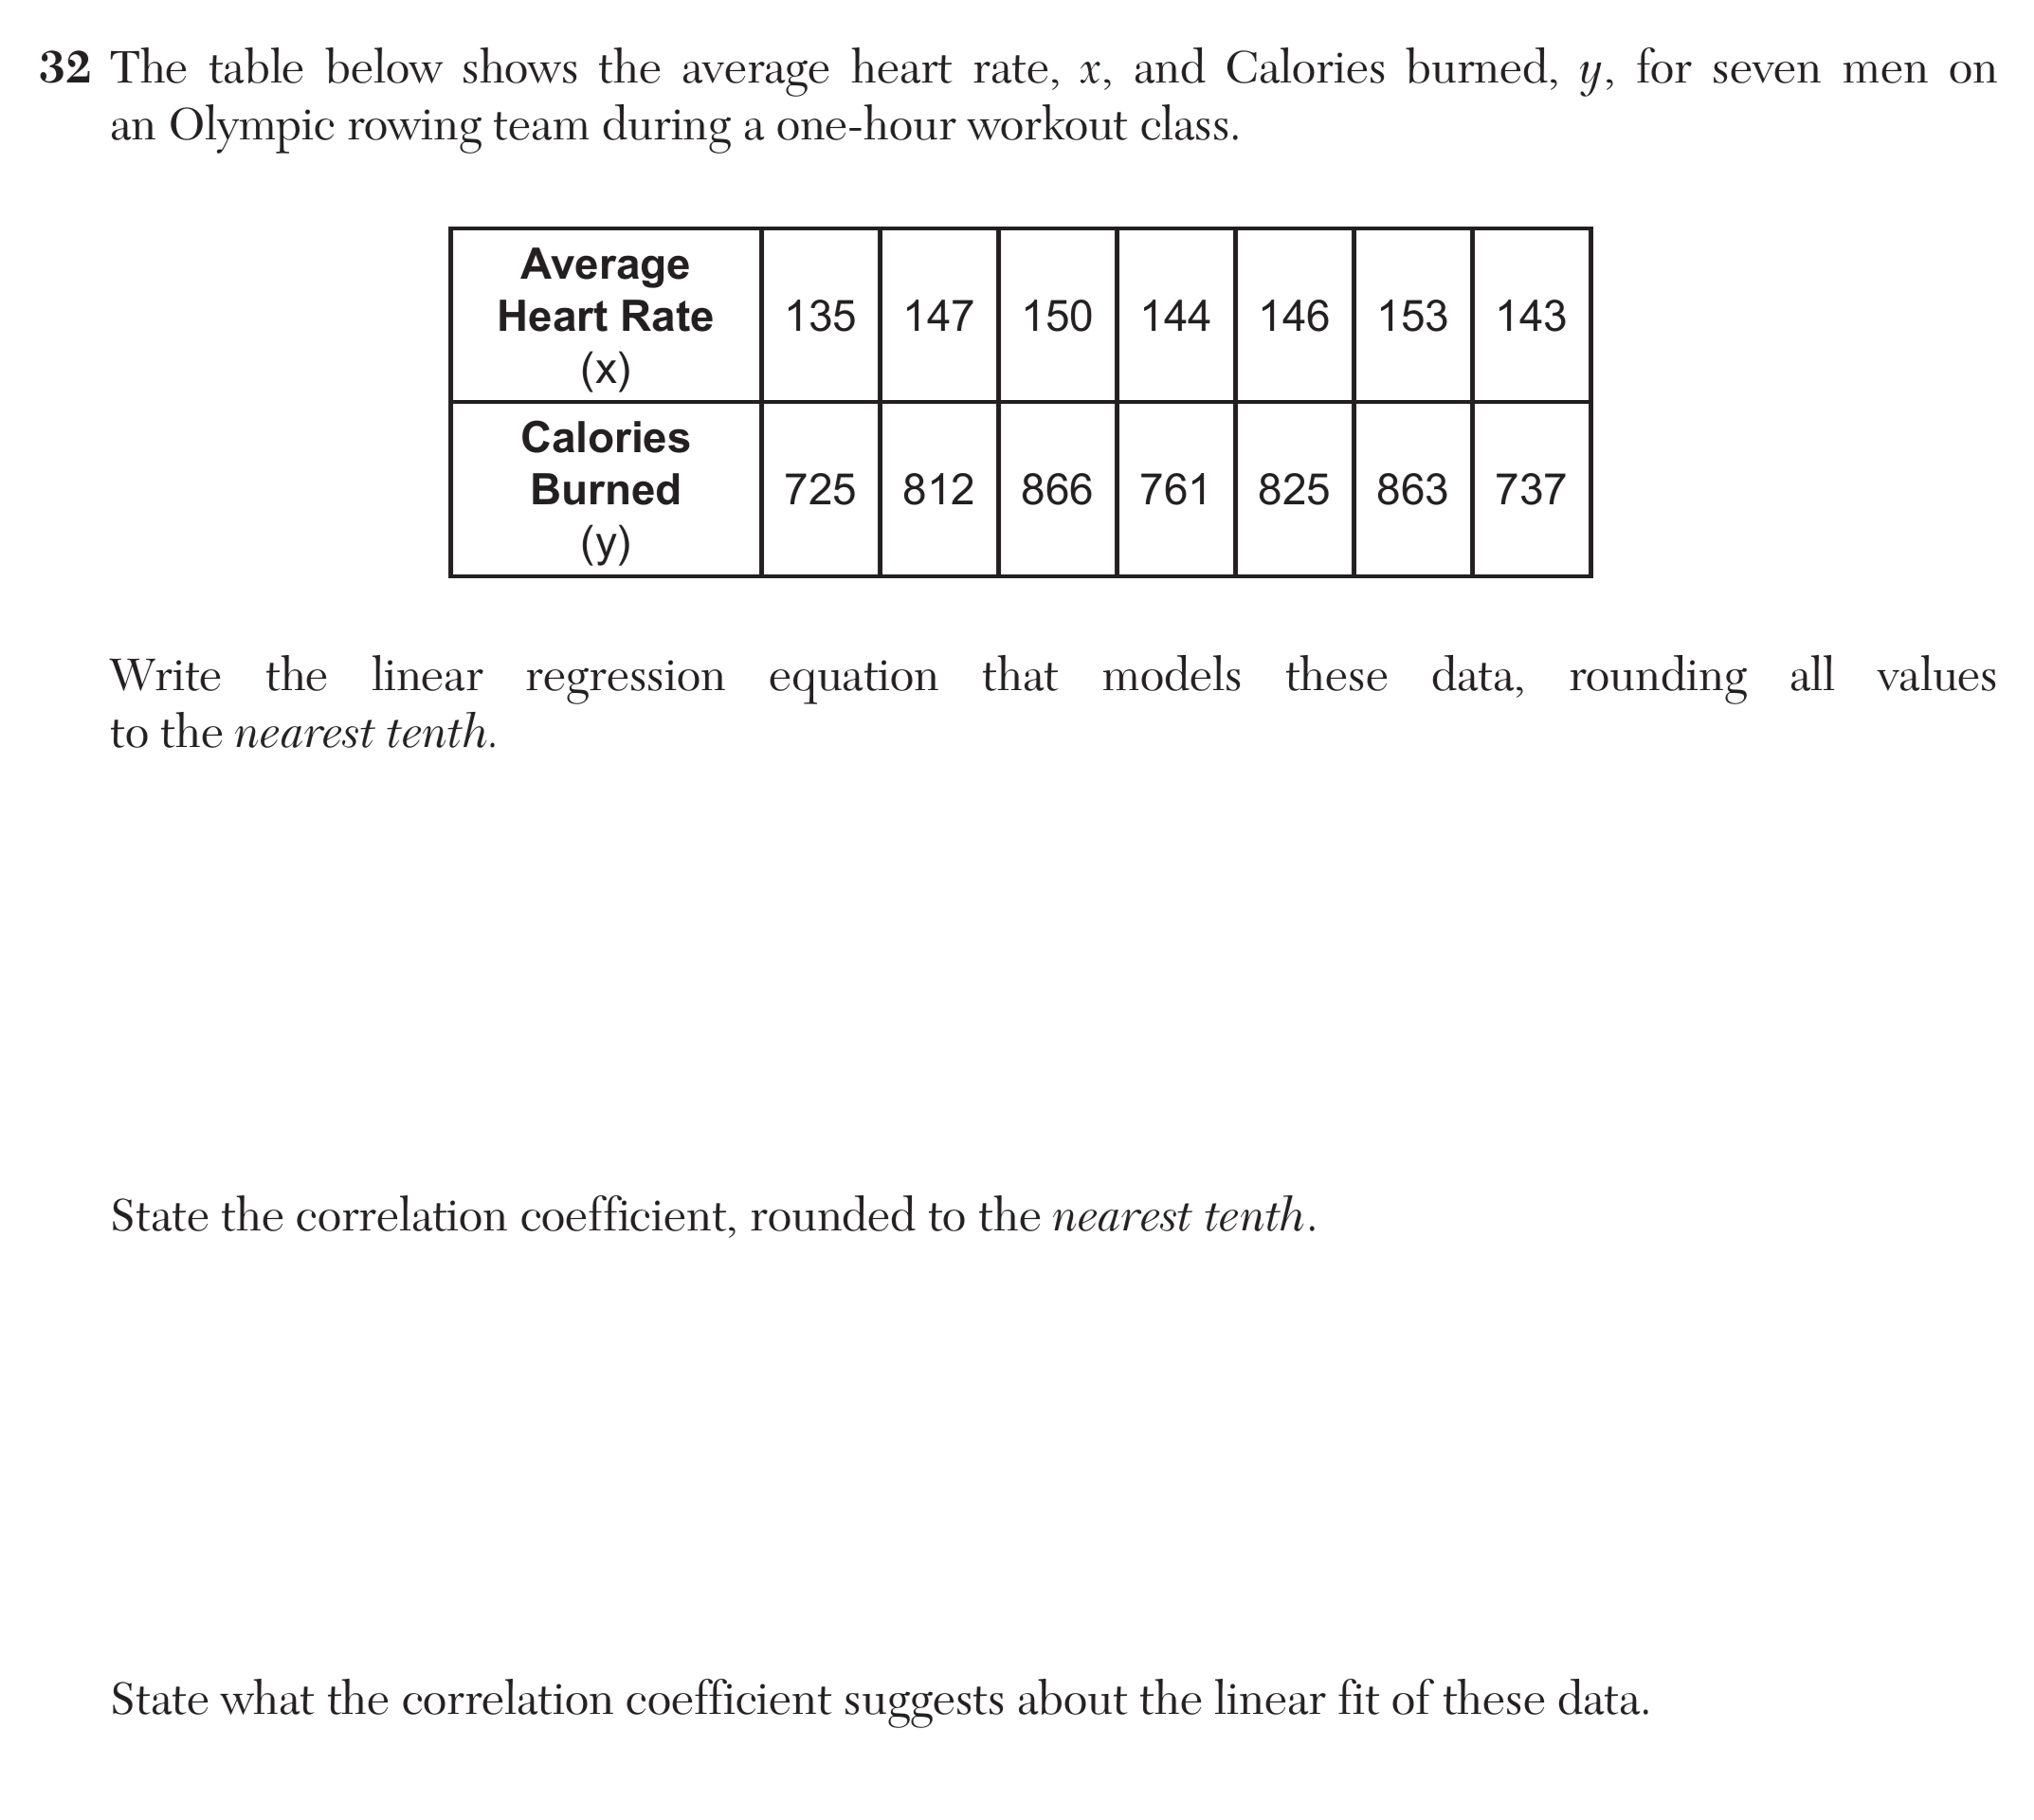
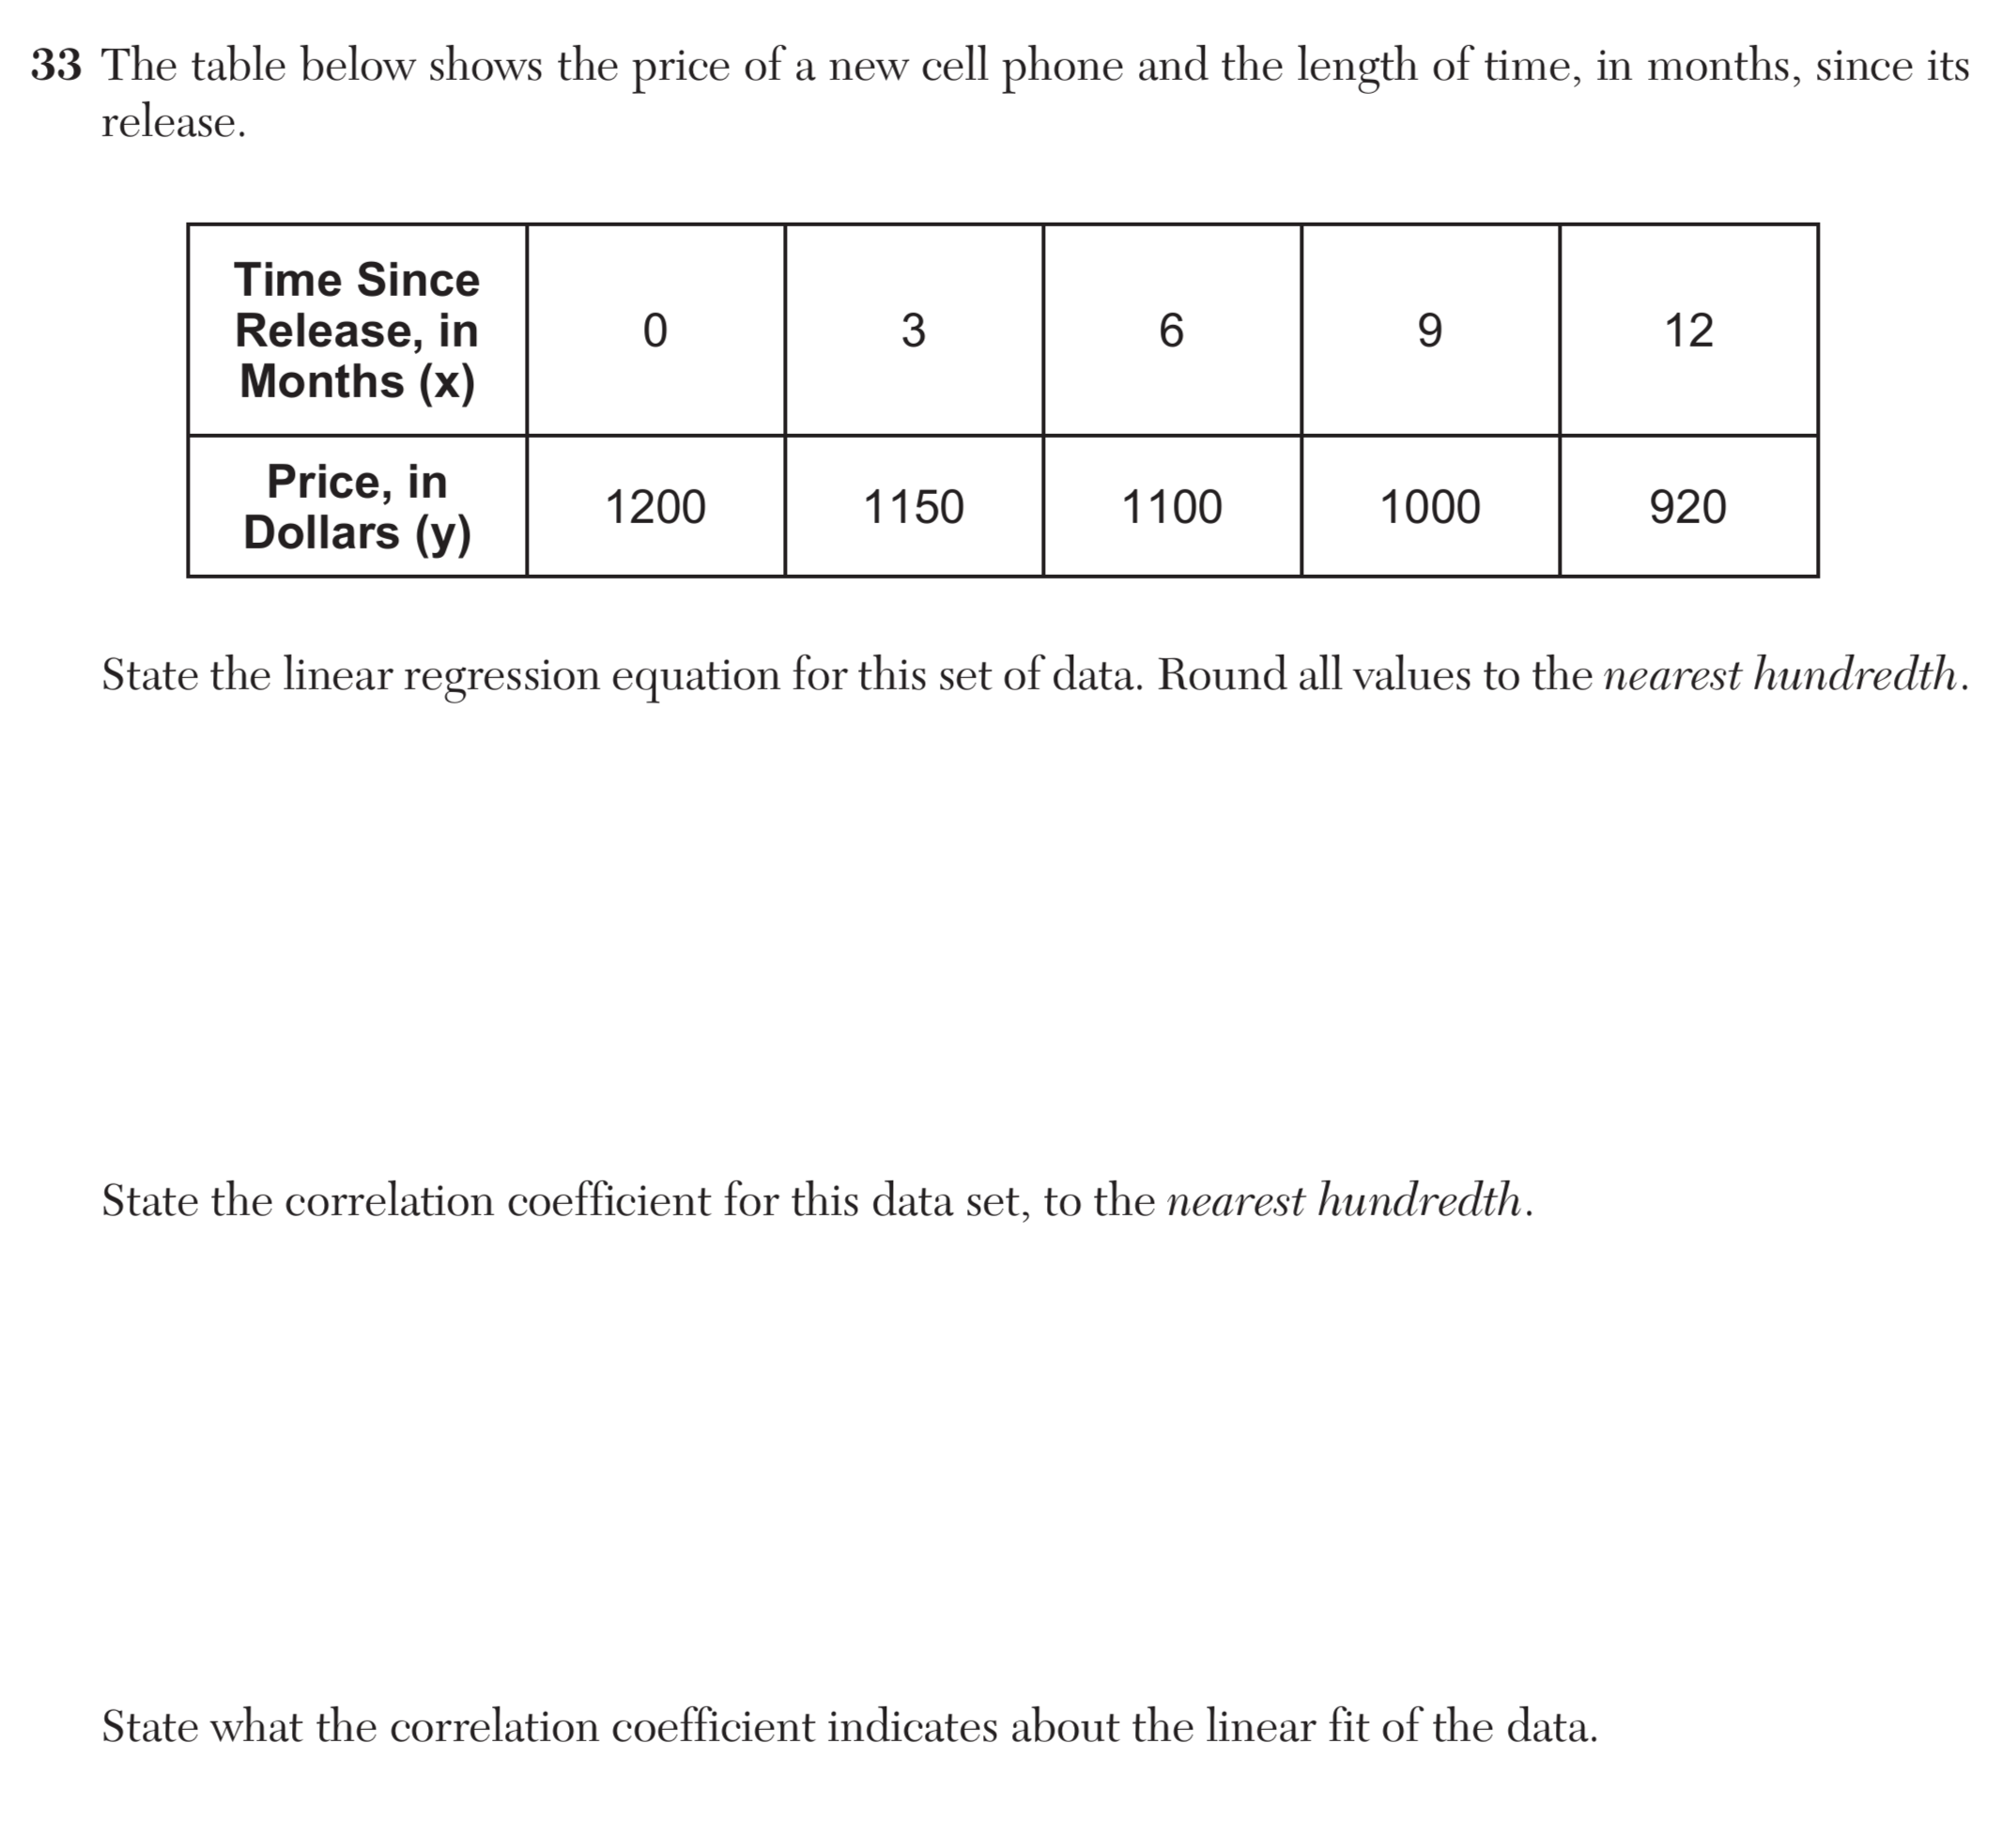
Calculate (using technology) and interpret the correlation coefficient of a linear fit.
HSS-ID.C.85 questions
Calculate (using technology) and interpret the correlation coefficient of a linear fit.