Patterns of Growth
Student Summary
Here are two tables representing two different situations.
- A student runs errands for a neighbor every week. The table shows the pay he may receive, in dollars, in any given week.
number of errands pay in dollars difference from previous week factor from previous week 0 10 - - 1 15 5 1.5 2 20 5 1.33 3 25 5 1.25 4 30 5 1.2 - A student at a high school heard a rumor that a celebrity will be speaking at graduation. The table shows how the rumor is spreading over time, in days.
day people who have
heard the rumordifference from previous day factor from previous
day0 1 - - 1 5 4 5 2 25 20 5 3 125 100 5 4 625 500 5
Once we recognize how these patterns change, we can describe them mathematically. This allows us to understand their behavior, extend the patterns, and make predictions.
Notice that in the situation with the student running errands, the difference is constant from week to week, while the factor changes. In the situation about a rumor spreading, the difference changes from day to day, but the factor is constant. This can give us clues to how we might write out the pattern in each situation.
Visual / Anchor Chart

Standards
F-BF.1.a
Write a function that describes a relationship between two quantities.
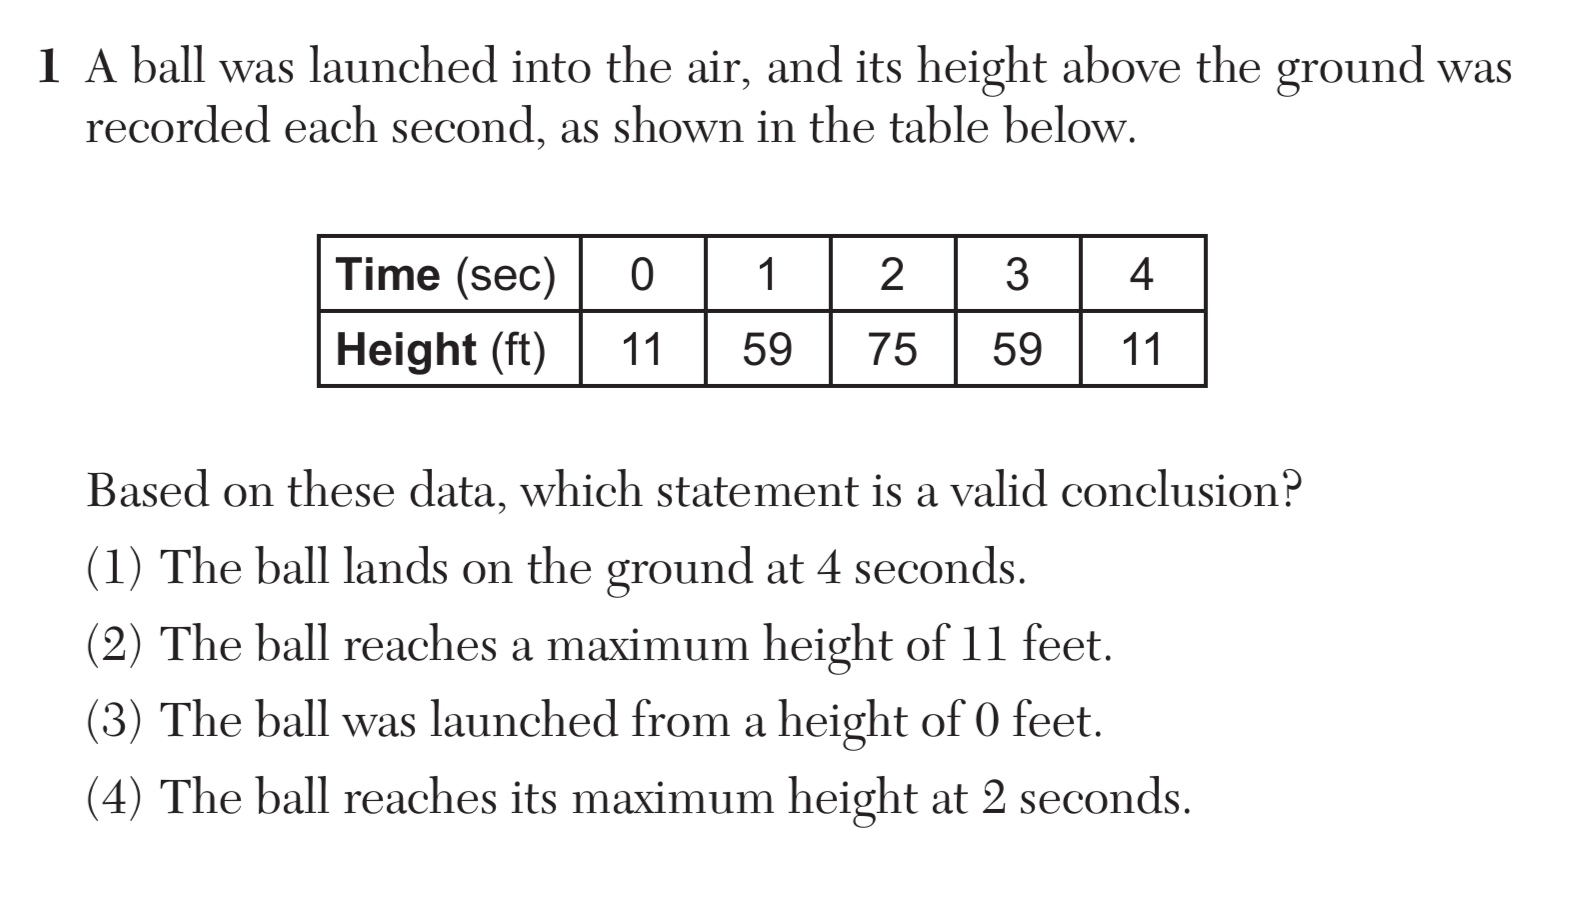
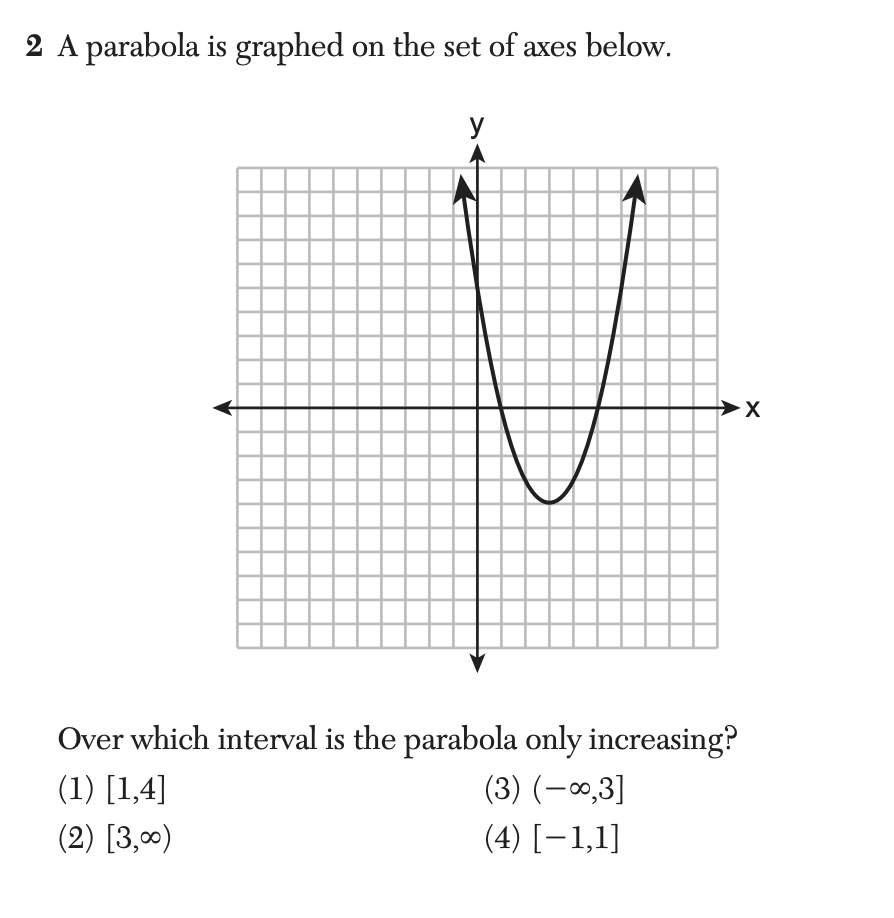
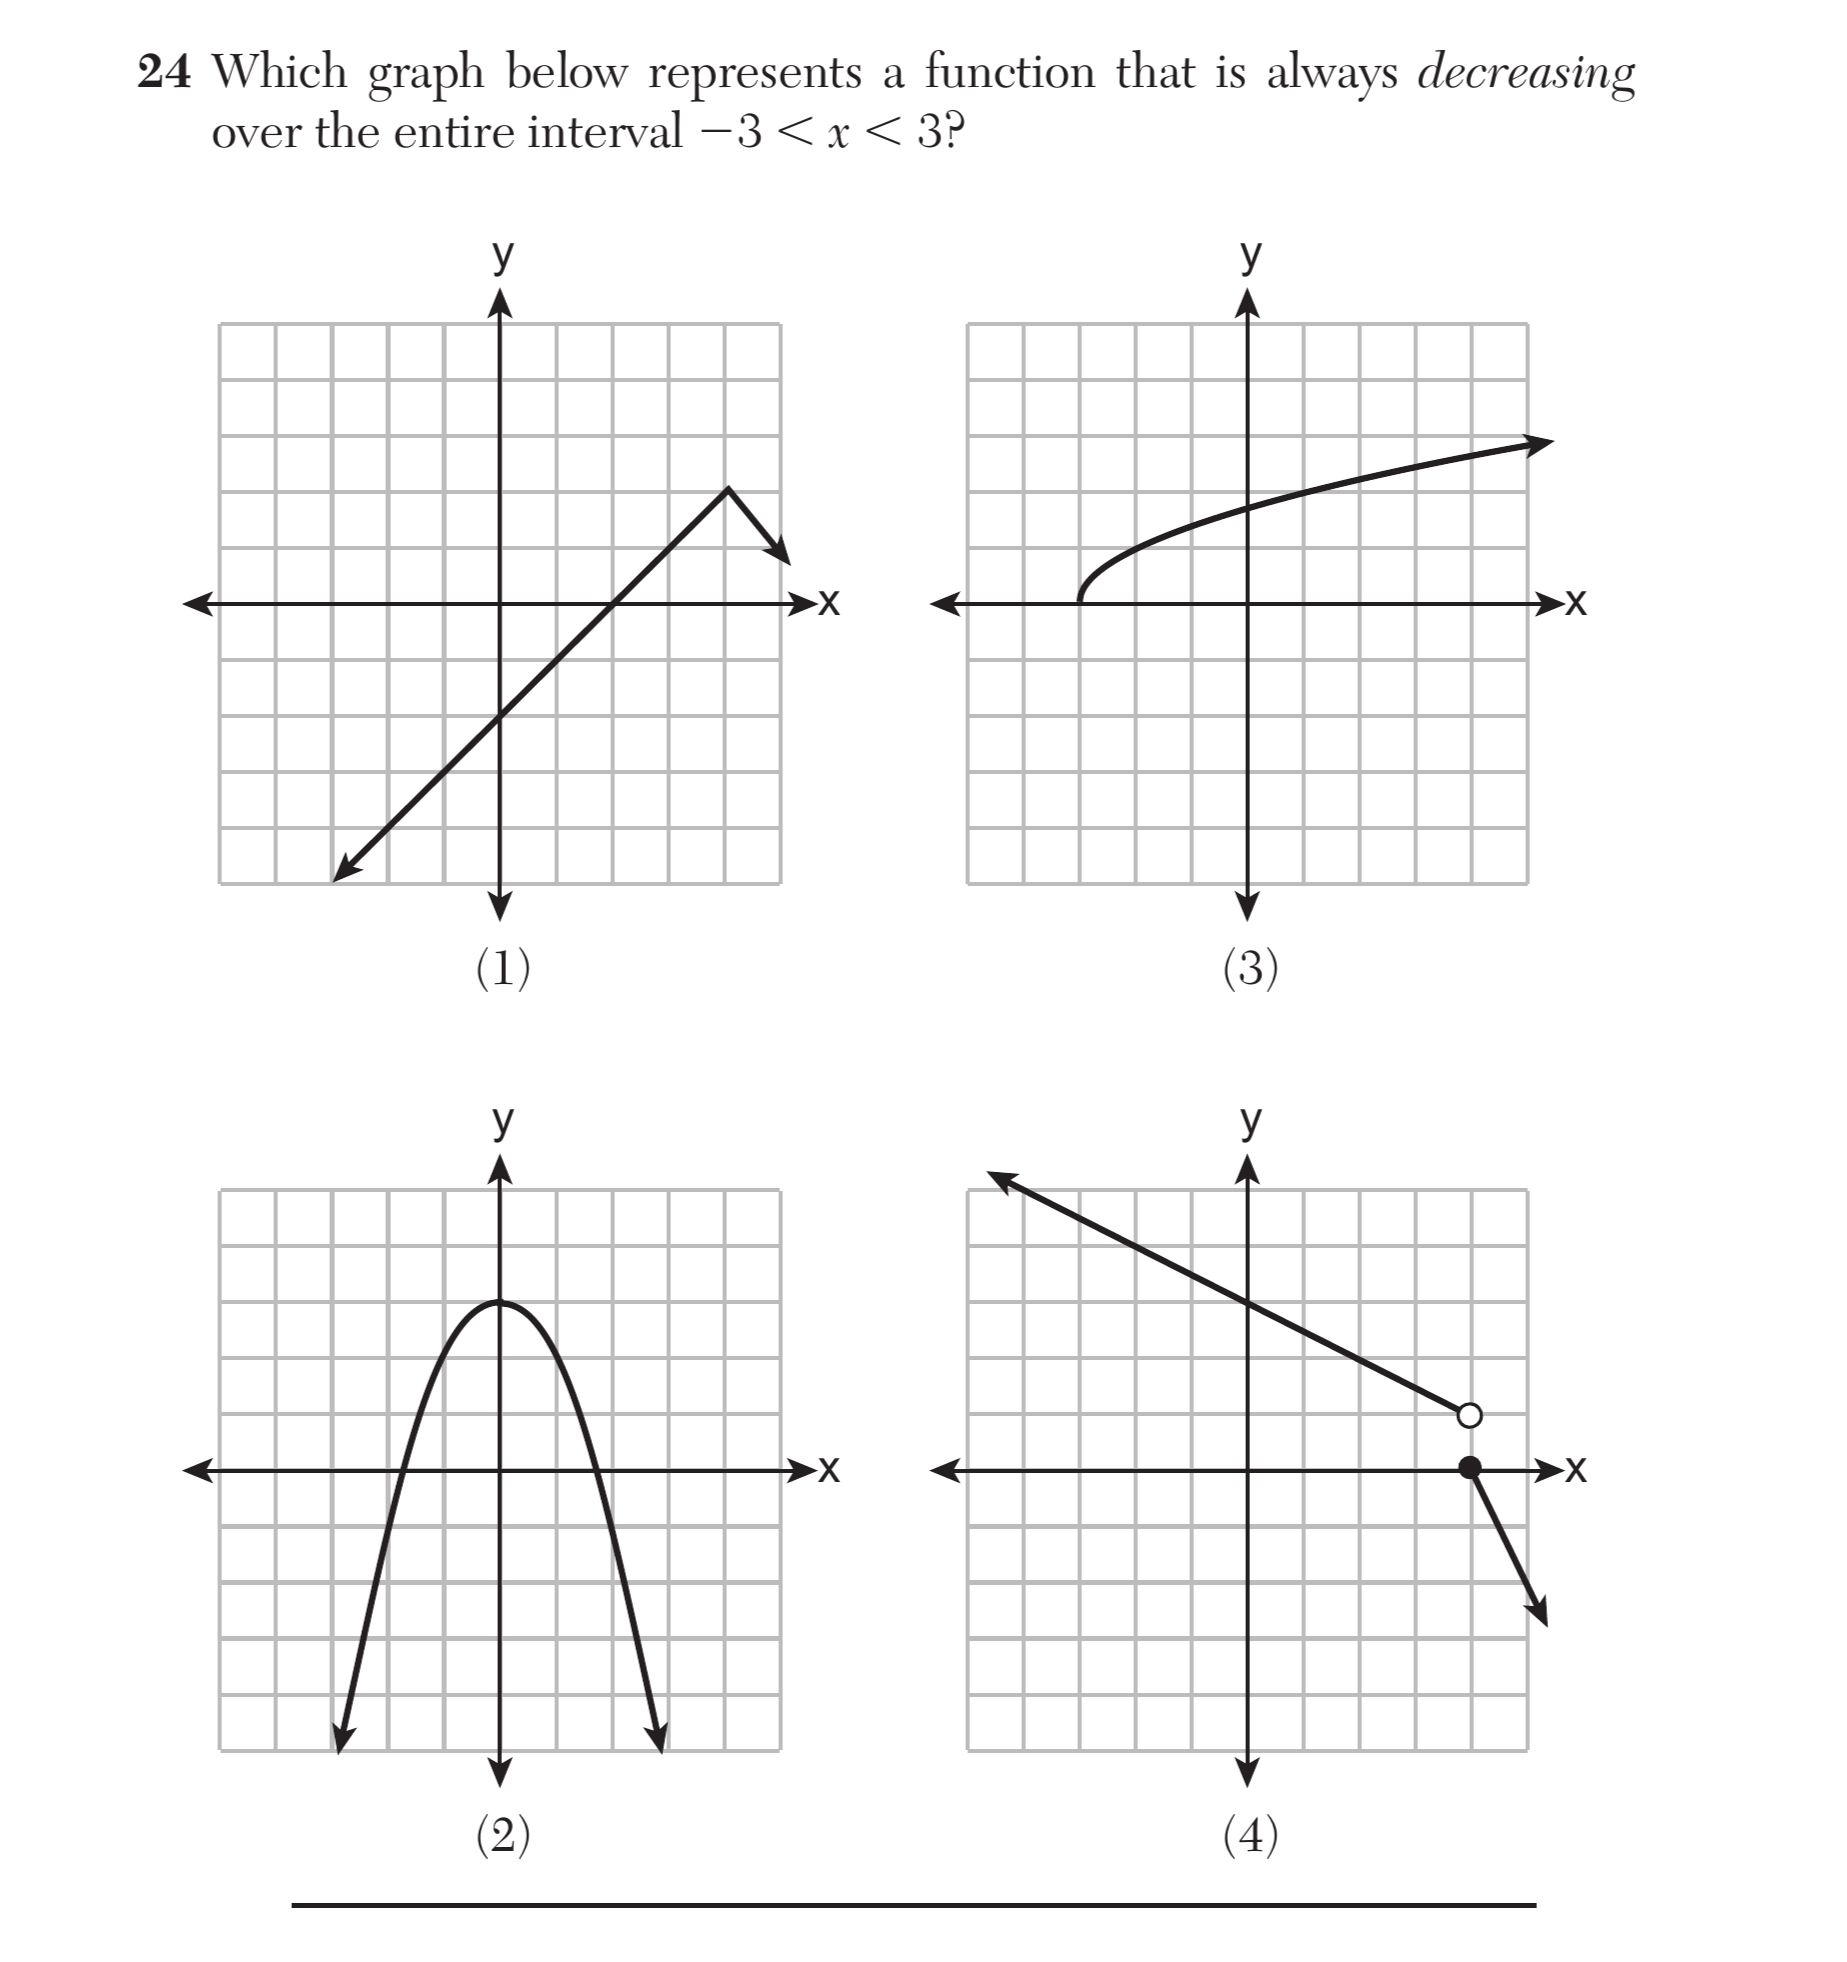
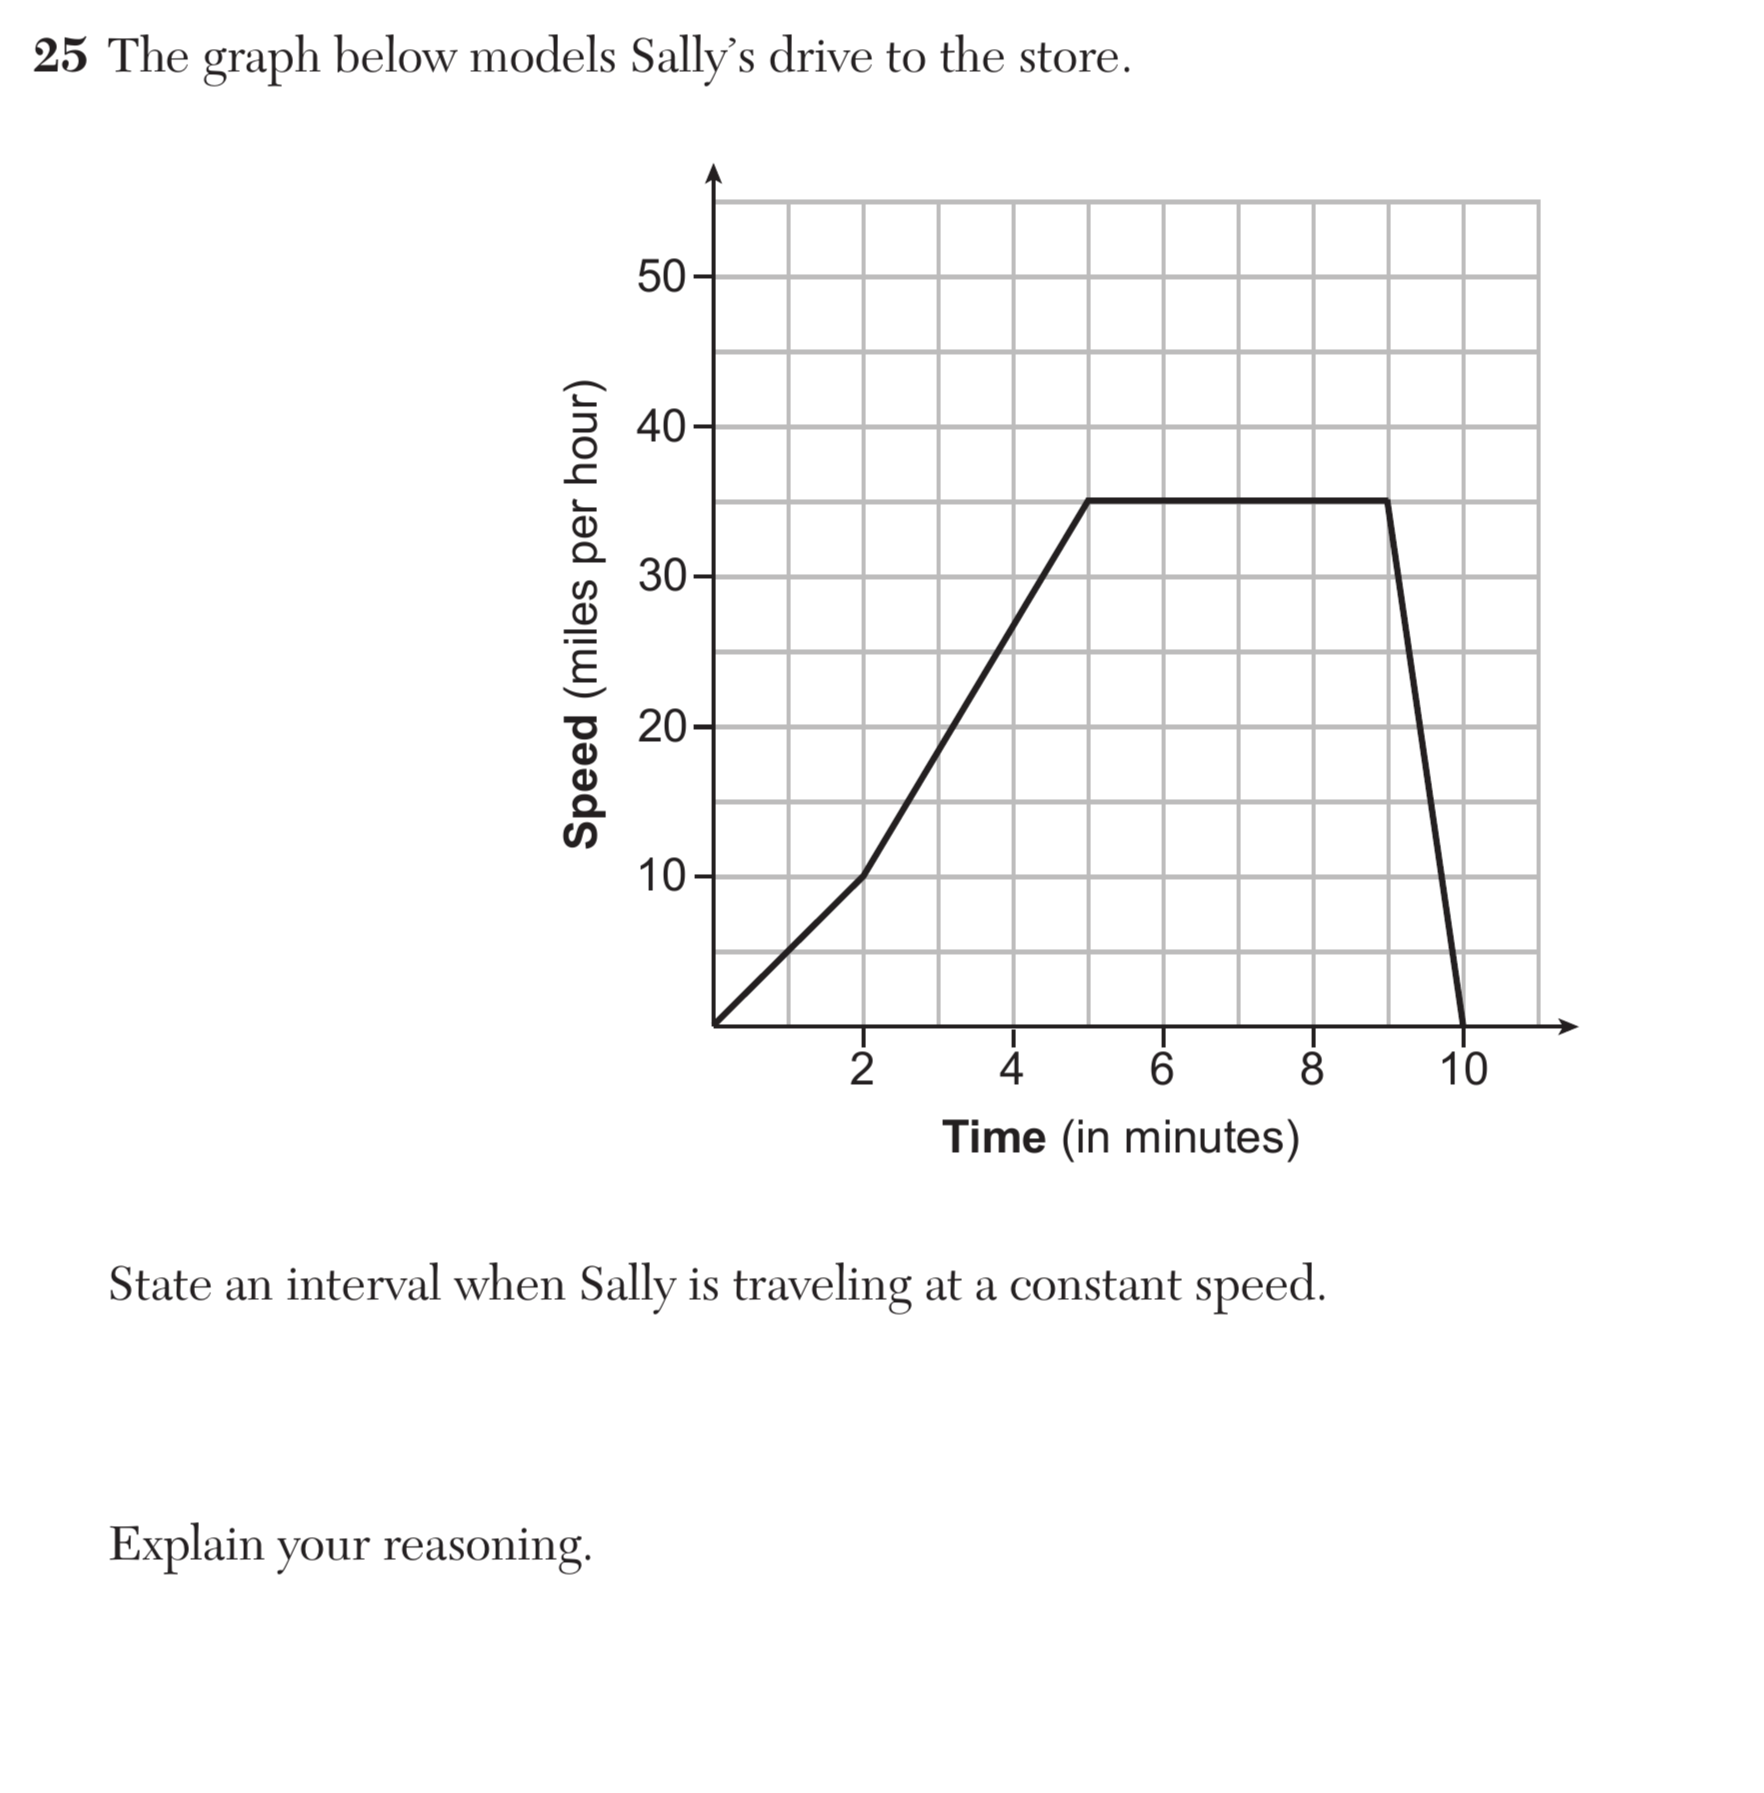
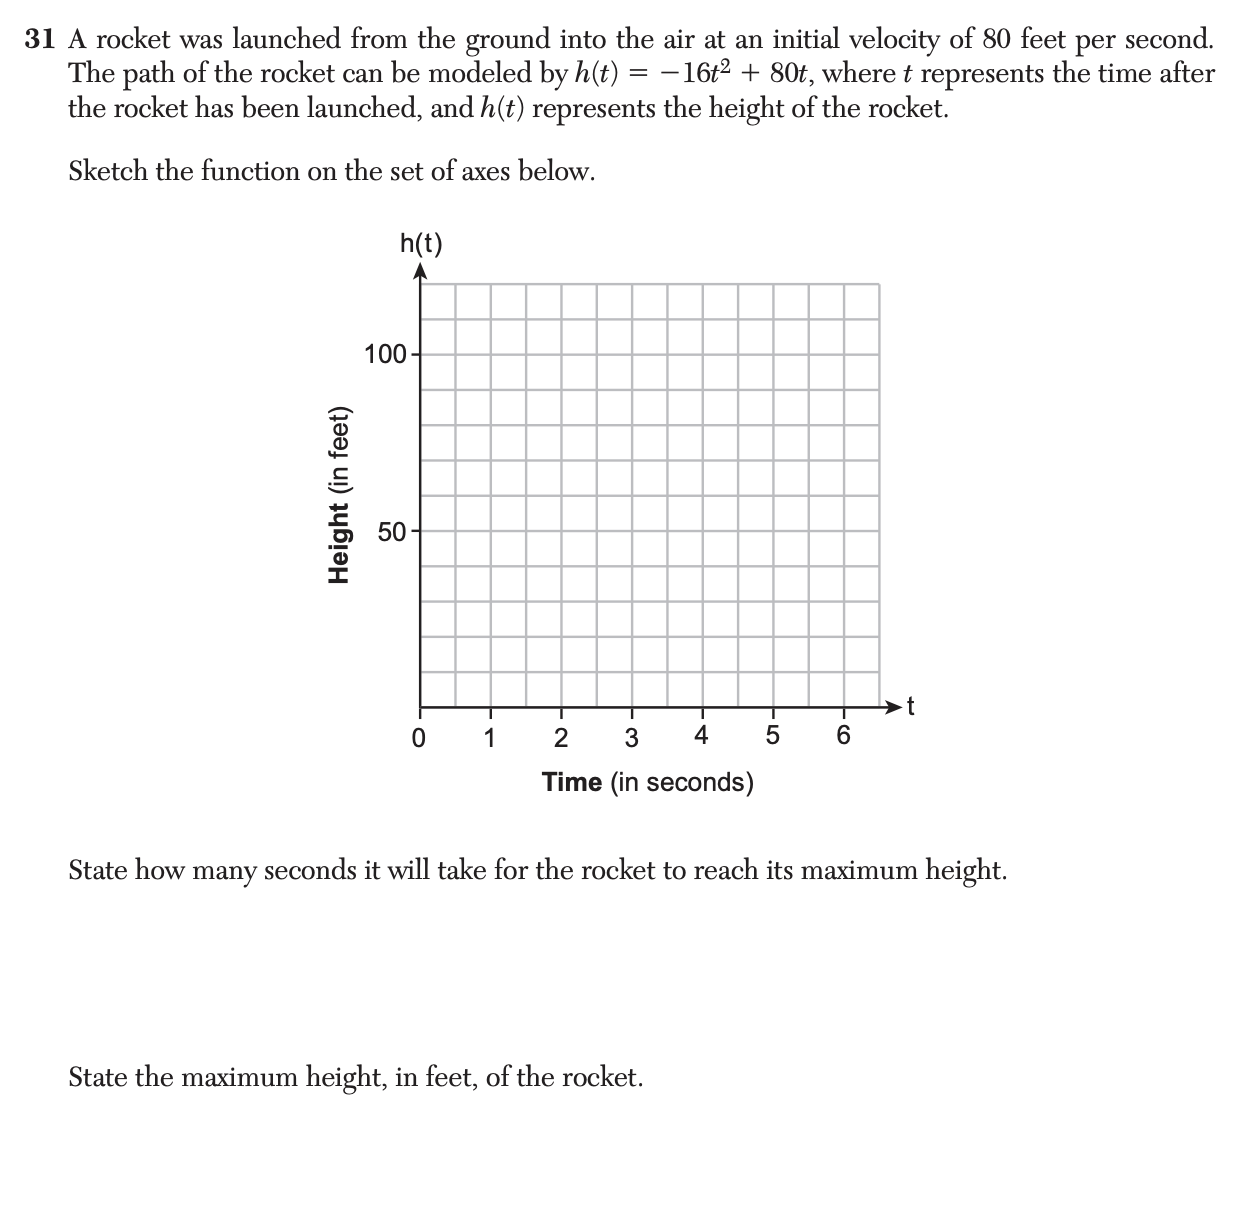
F-IF.45 questions
For a function that models a relationship between two quantities: i) interpret key features of graphs and tables in terms of the quantities; and ii) sketch graphs showing key features given a verbal description of the relationship.
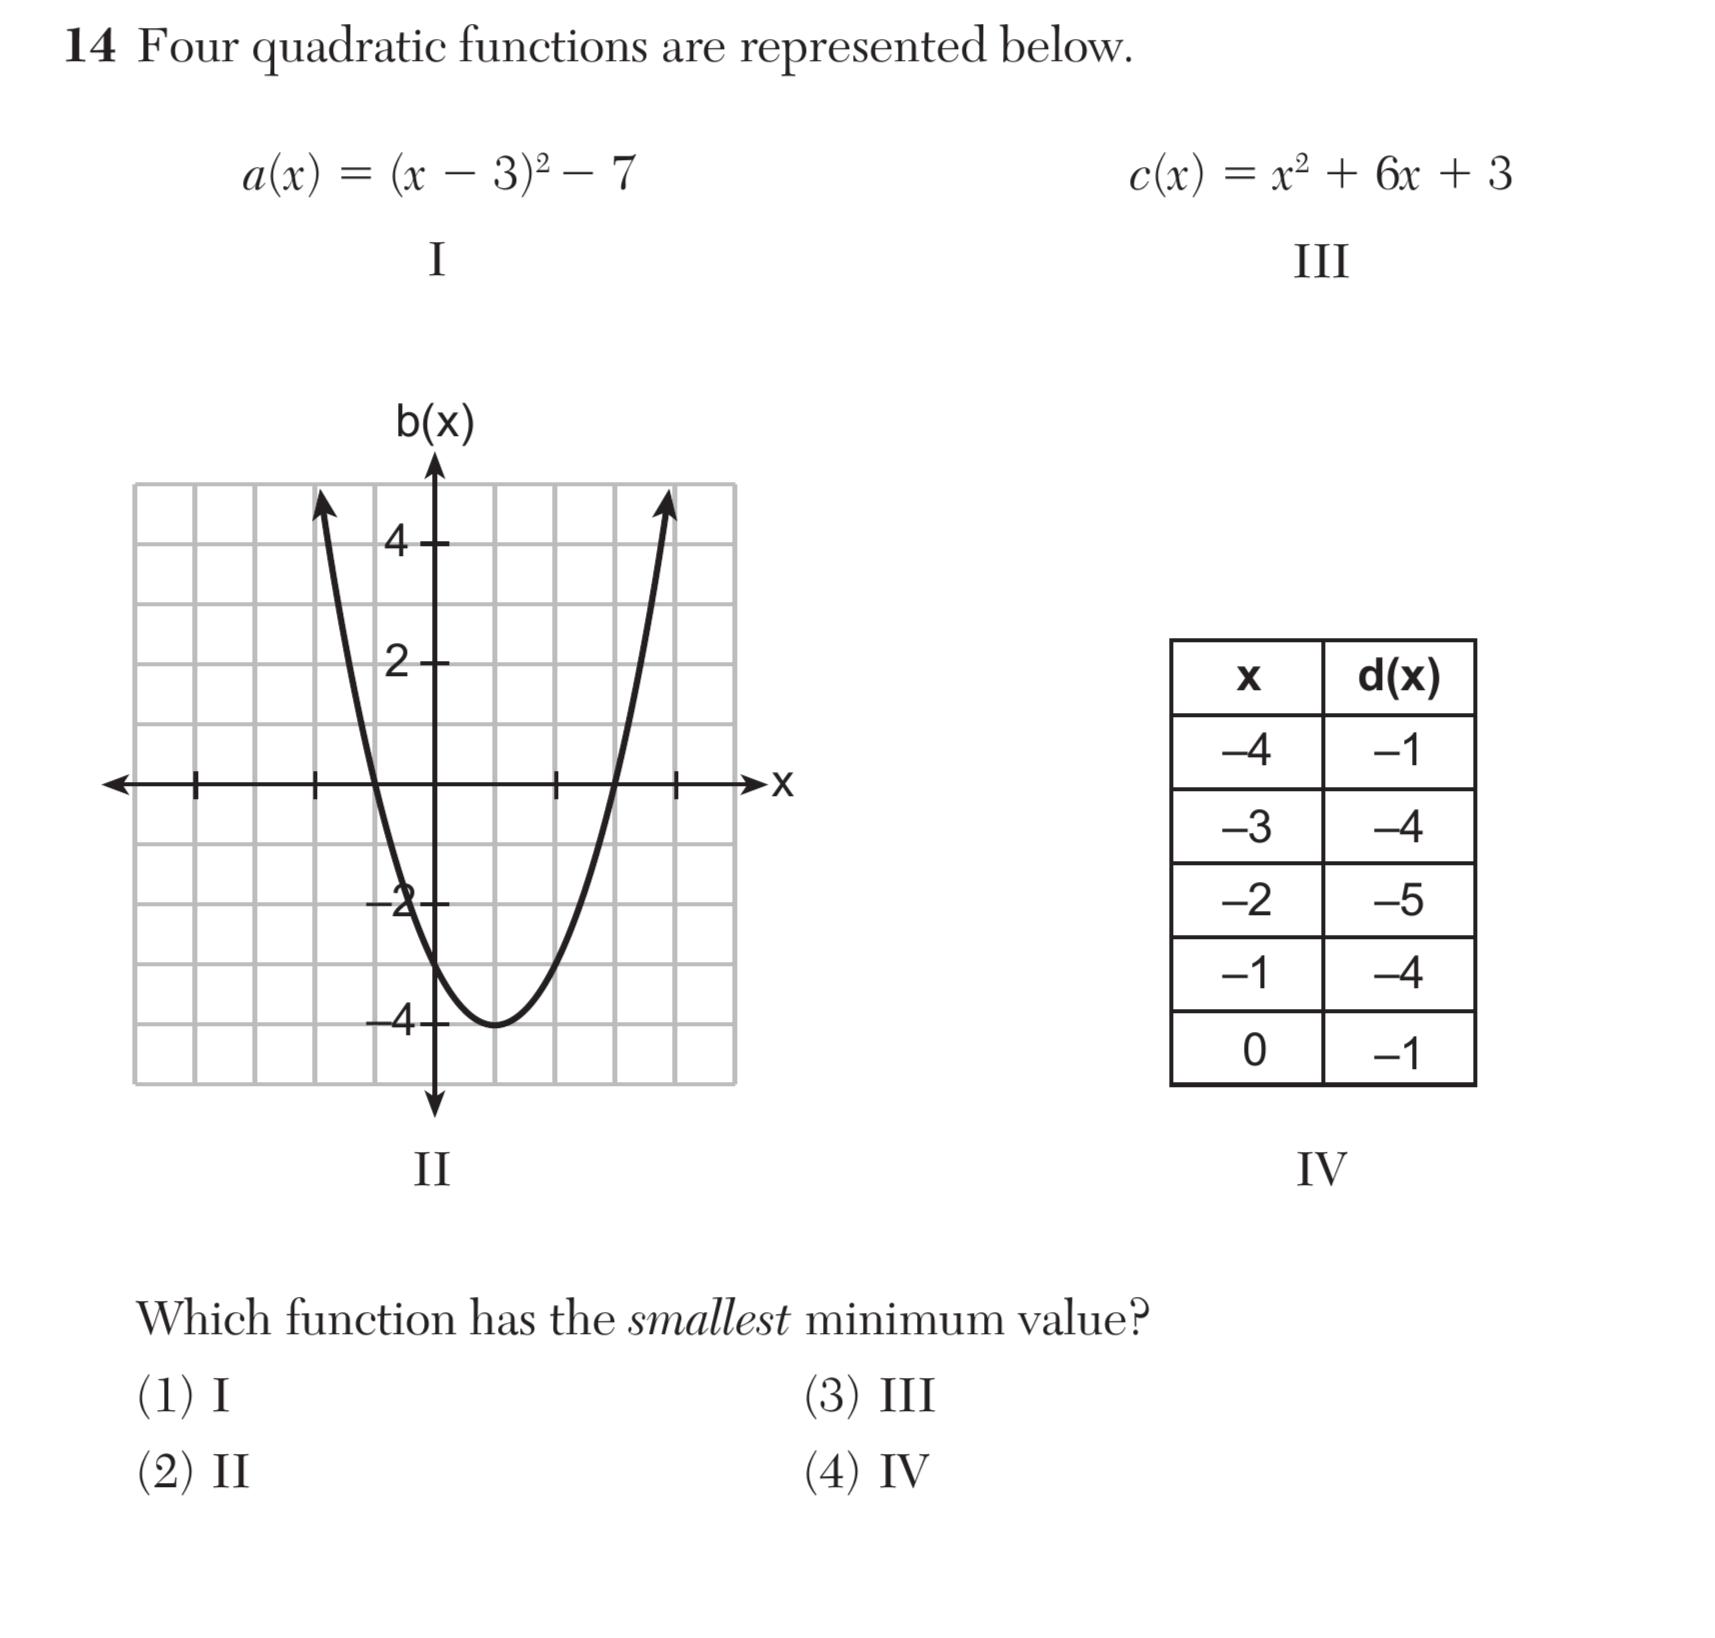
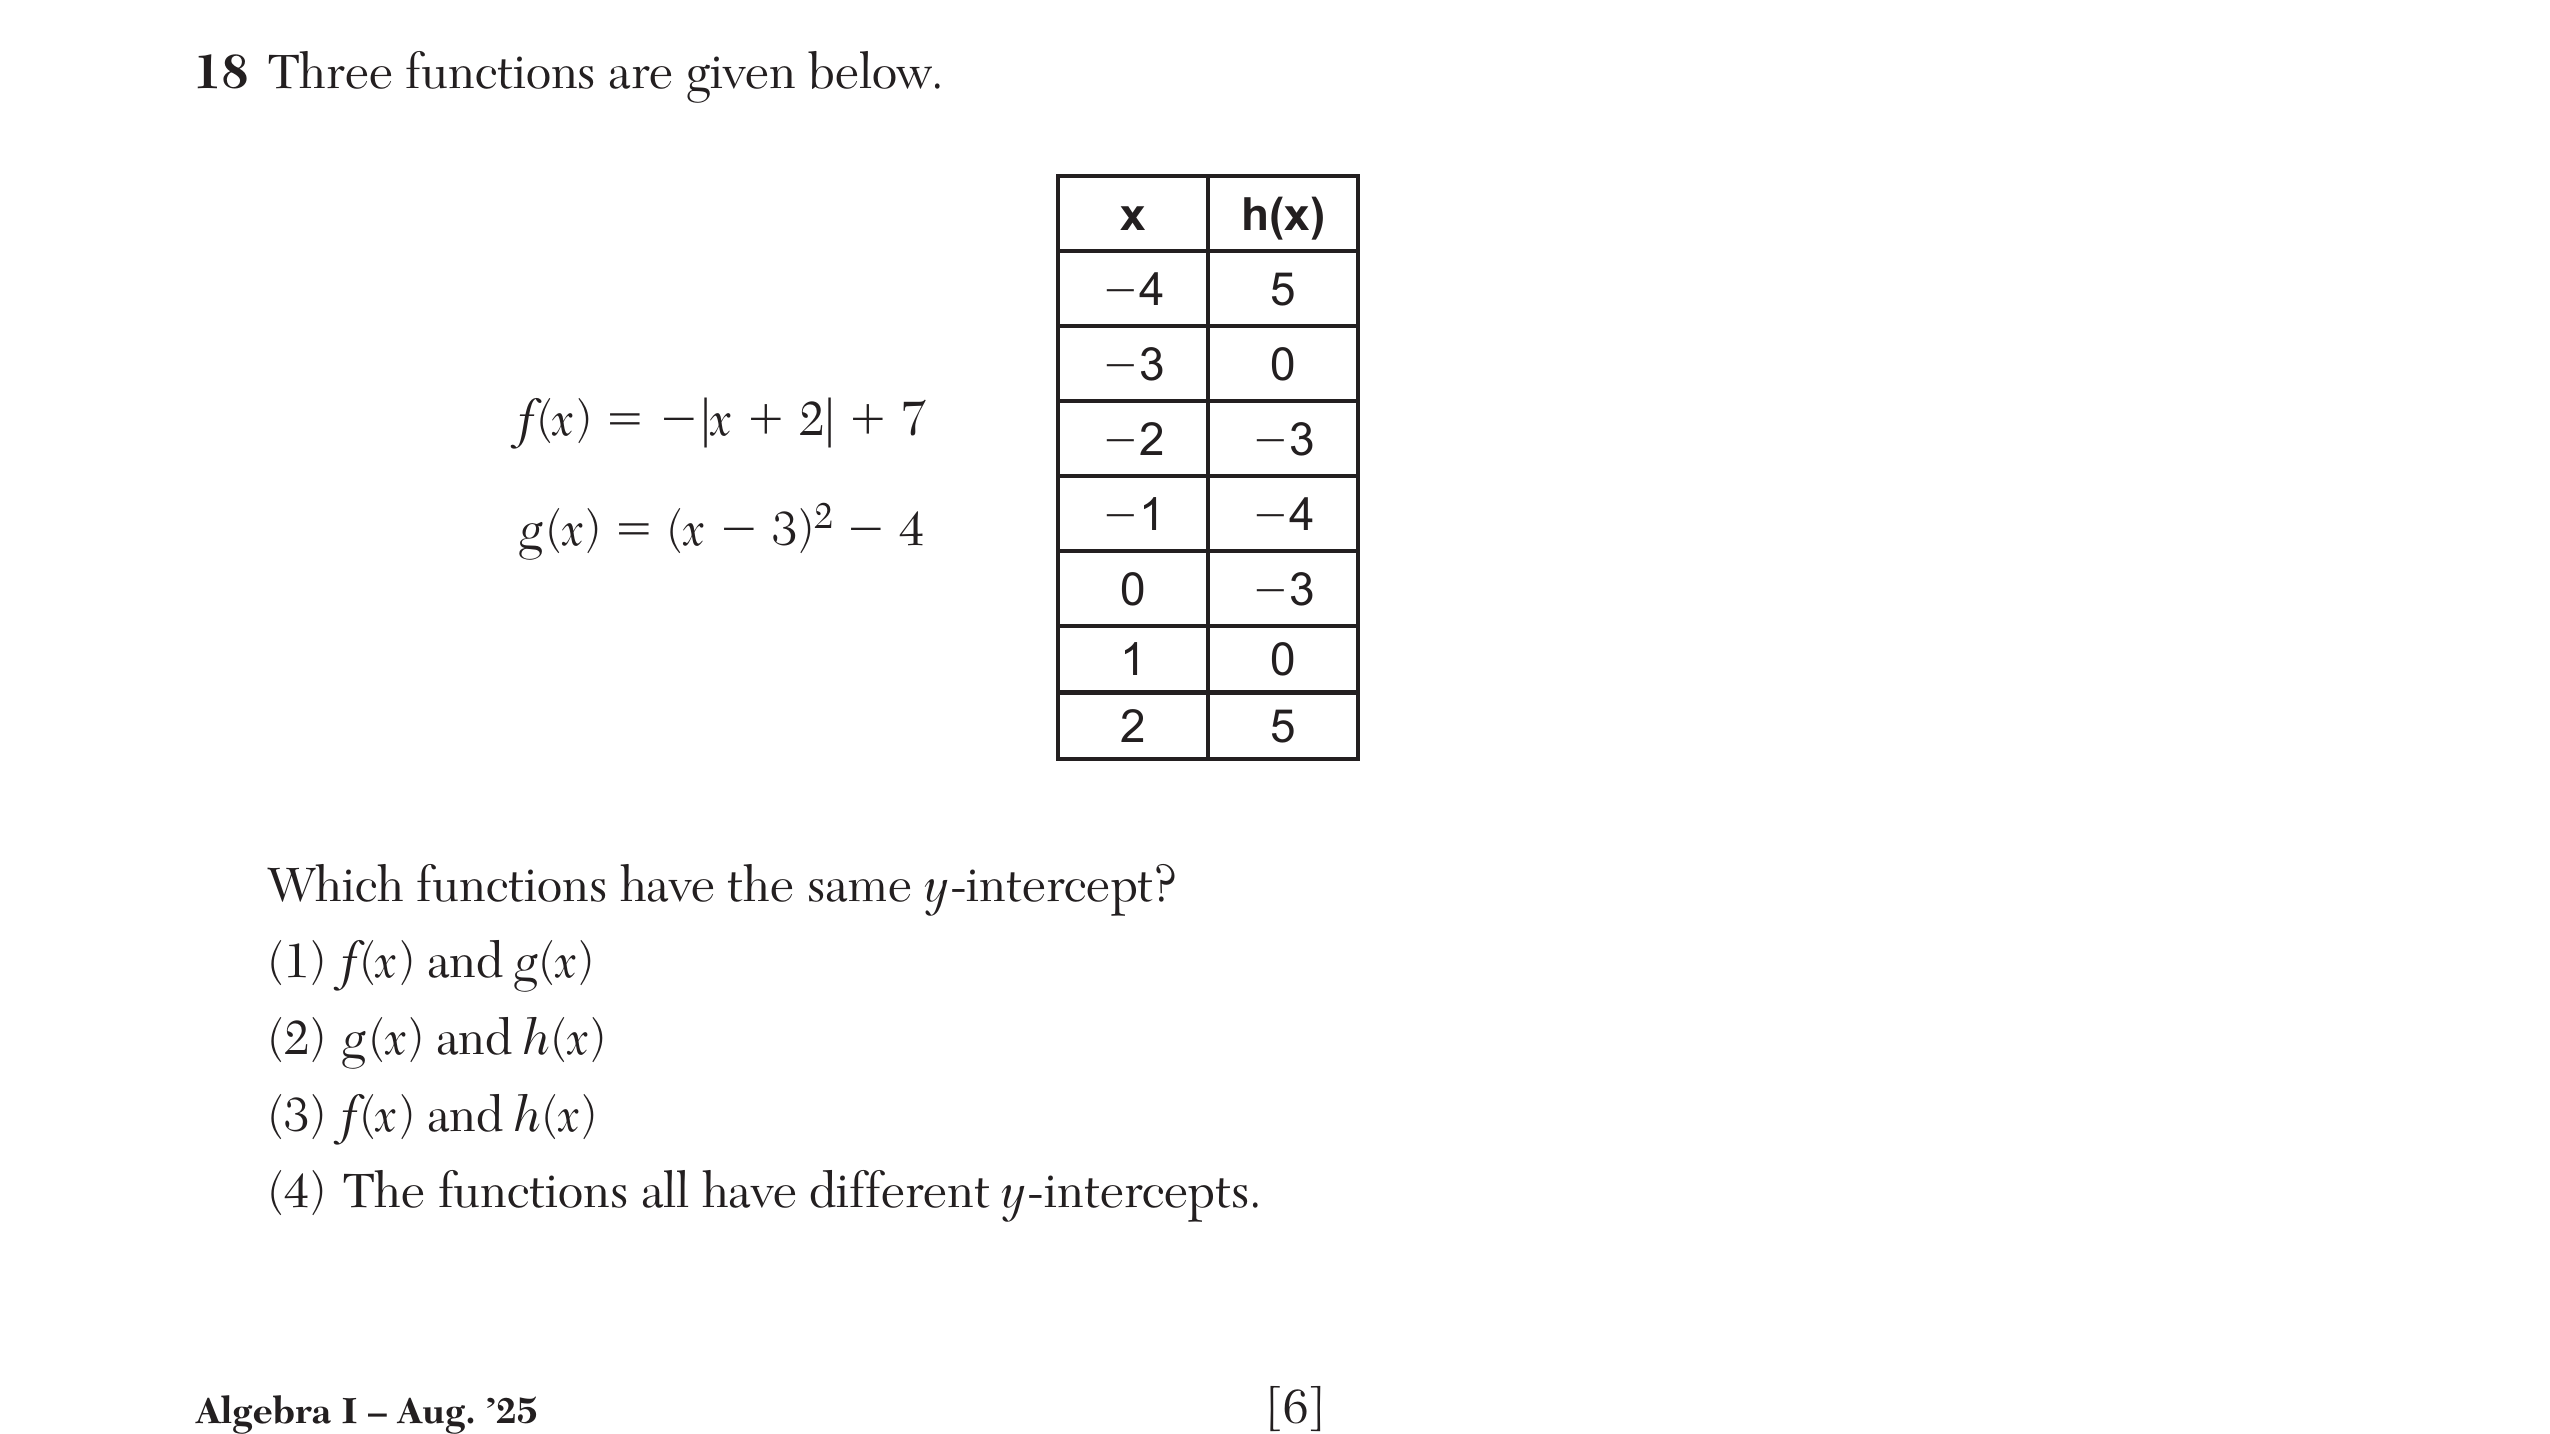
F-IF.92 questions
Compare properties of two functions each represented in a different way (algebraically, graphically, numerically in tables, or by verbal descriptions).
F-BF.A
No additional information available.
F-LE.2
No additional information available.
F-LE.1
No additional information available.