Function Notation
Student Summary
Here are graphs of two functions, each representing the cost of riding in a taxi from two companies—Friendly Rides and Great Cabs.
For each taxi, the cost of a ride is a function of the distance traveled. The input is distance in miles, and the output is cost in dollars.
- The point (2,5.70) on one graph tells us the cost of riding a Friendly Rides taxi for 2 miles.
- The point (2,4.25) on the other graph tells us the cost of riding a Great Cabs taxi for 2 miles.
We can convey the same information much more efficiently by naming each function and using function notation to specify the input and the output.
- Let’s name the function for Friendly Rides function f.
- Let's name the function for Great Cabs function g.
- To refer to the cost of riding each taxi for 2 miles, we can write f(2) and g(2).
- To say that a 2-mile trip with Friendly Rides will cost $5.70, we can write f(2)=5.70.
- To say that a 2-mile trip with Great Cabs will cost $4.25, we can write g(2)=4.25.
In general, function notation has this form:
It is read “f of x” and can be interpreted to mean that f(x) is the output of a function f when x is the input.
The function notation is a concise way to refer to a function and describe its input and output, which can be very useful. Throughout this unit and the course, we will use function notation to talk about functions.
Visual / Anchor Chart

Standards
F-IF.45 questions
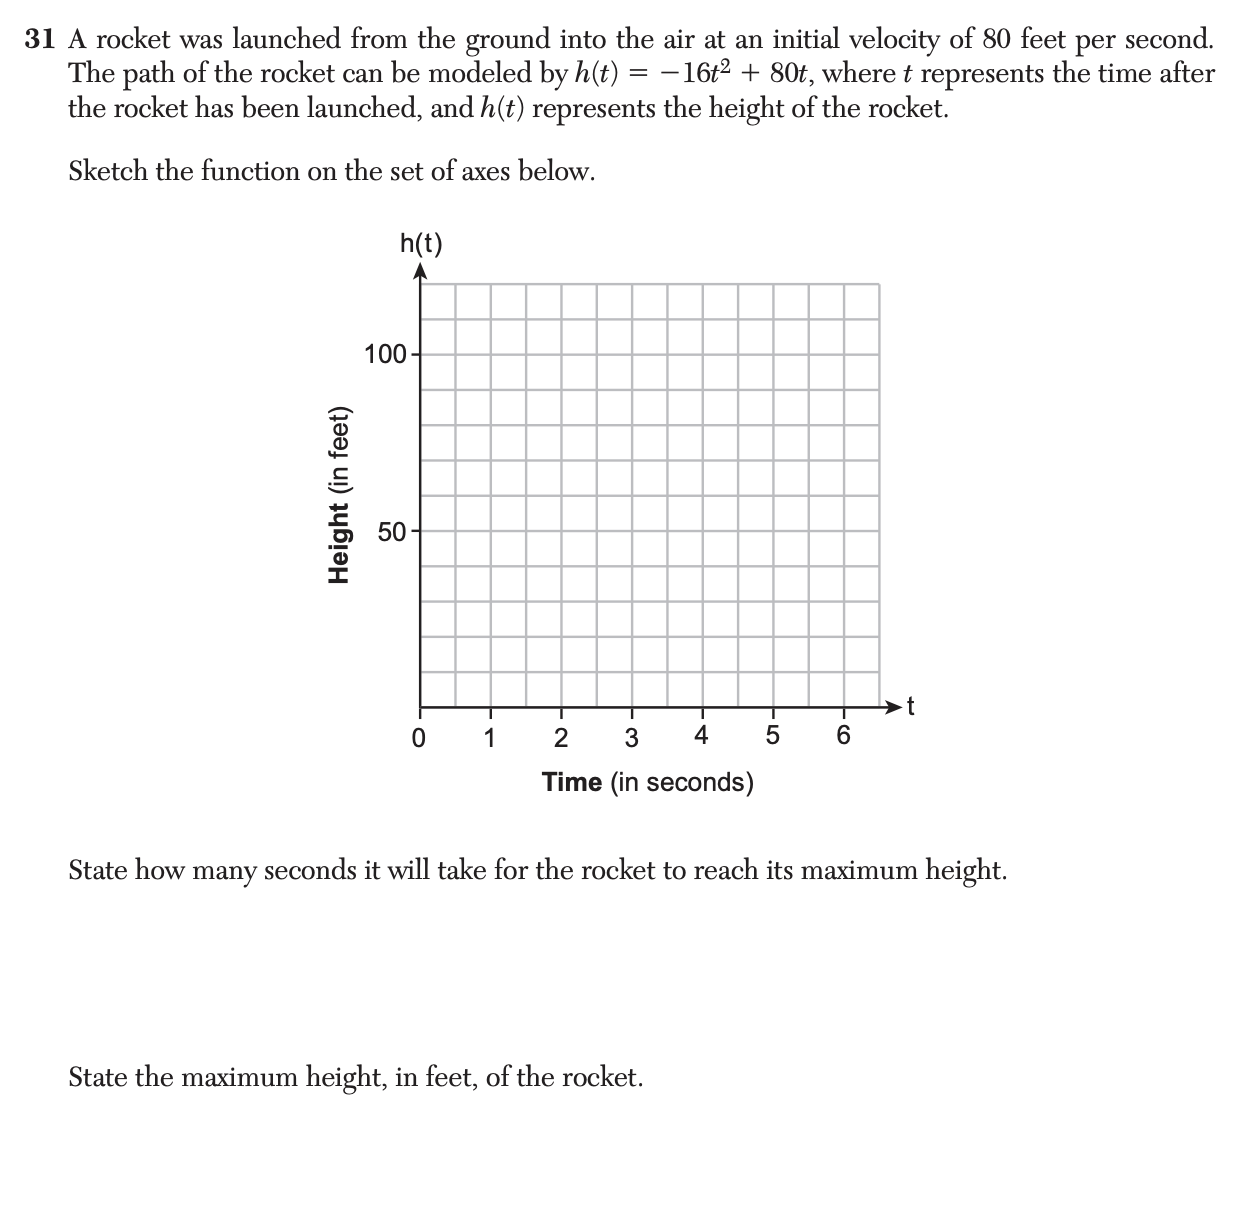
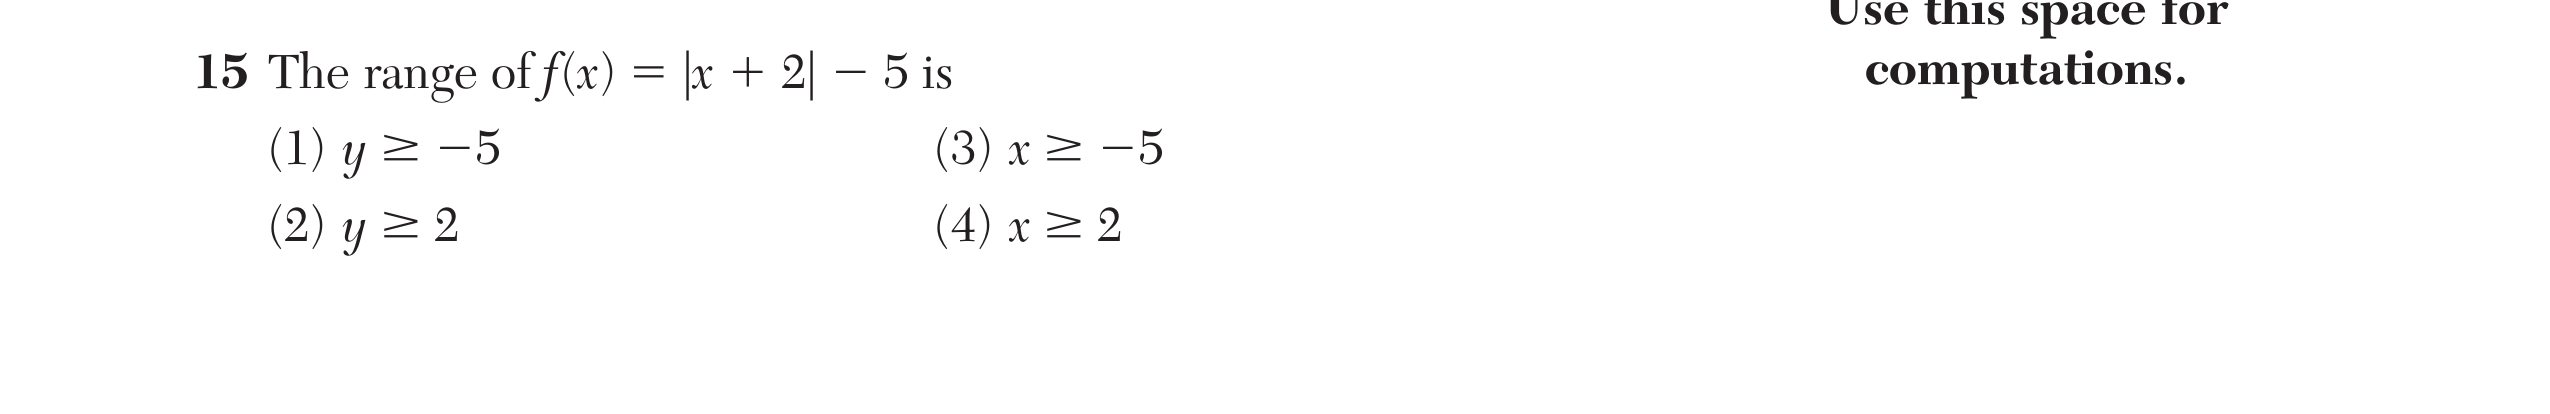
For a function that models a relationship between two quantities: i) interpret key features of graphs and tables in terms of the quantities; and ii) sketch graphs showing key features given a verbal description of the relationship.
F-IF.17 questions
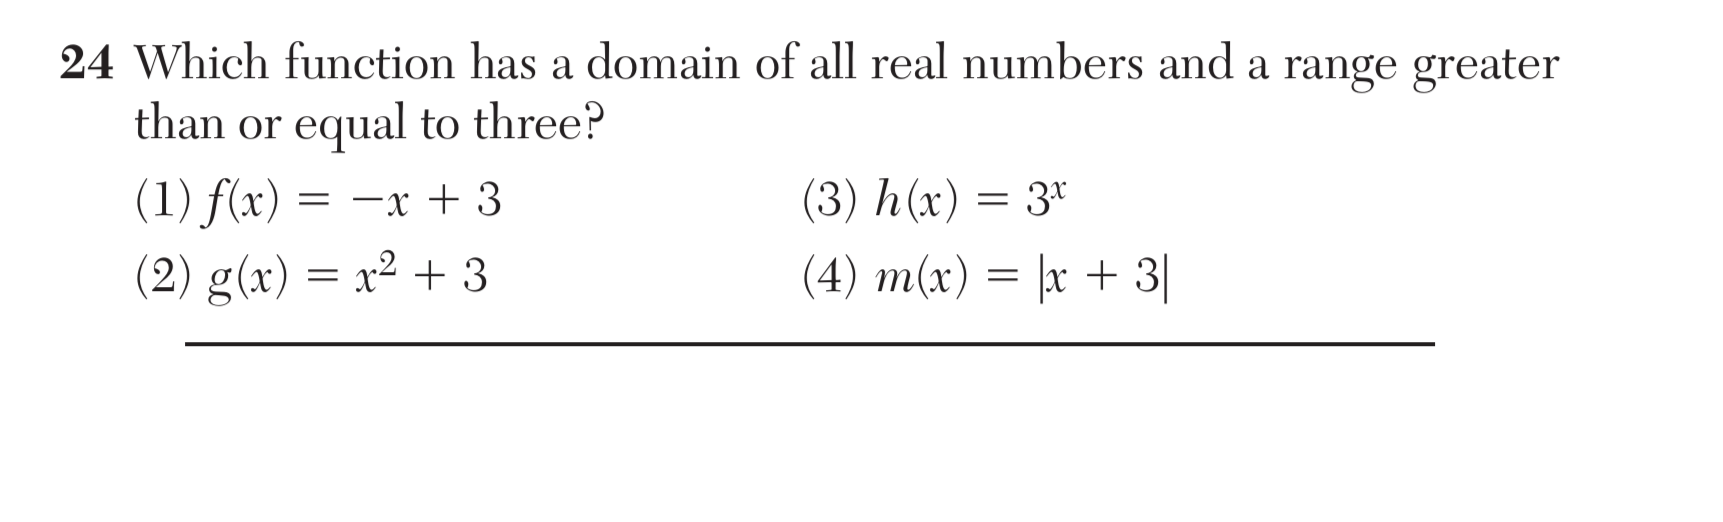
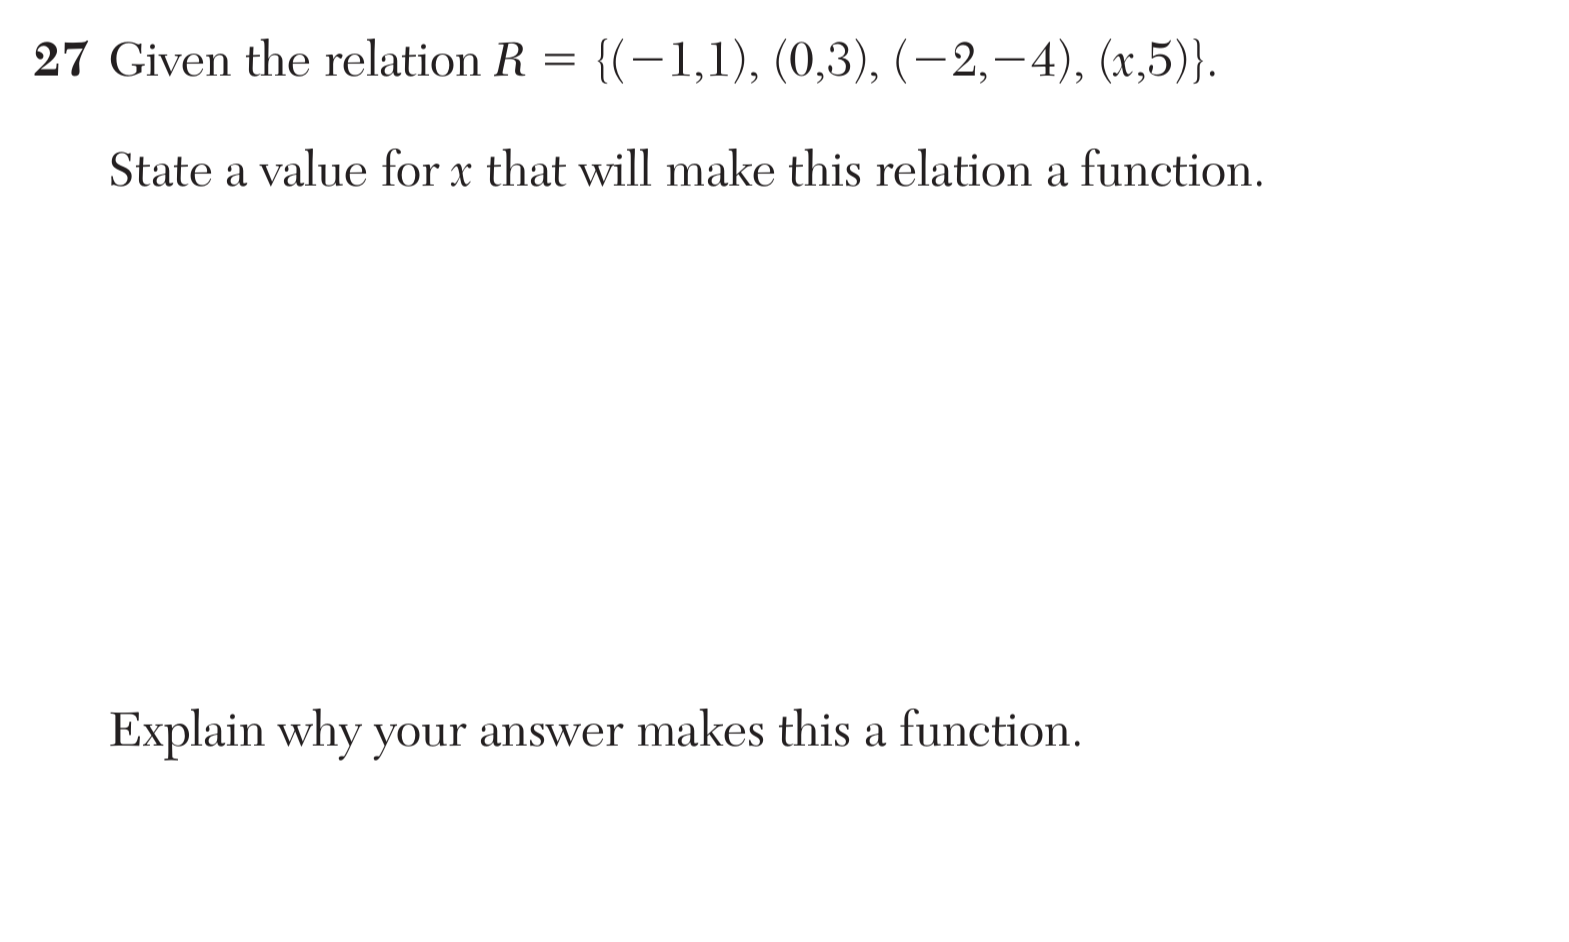
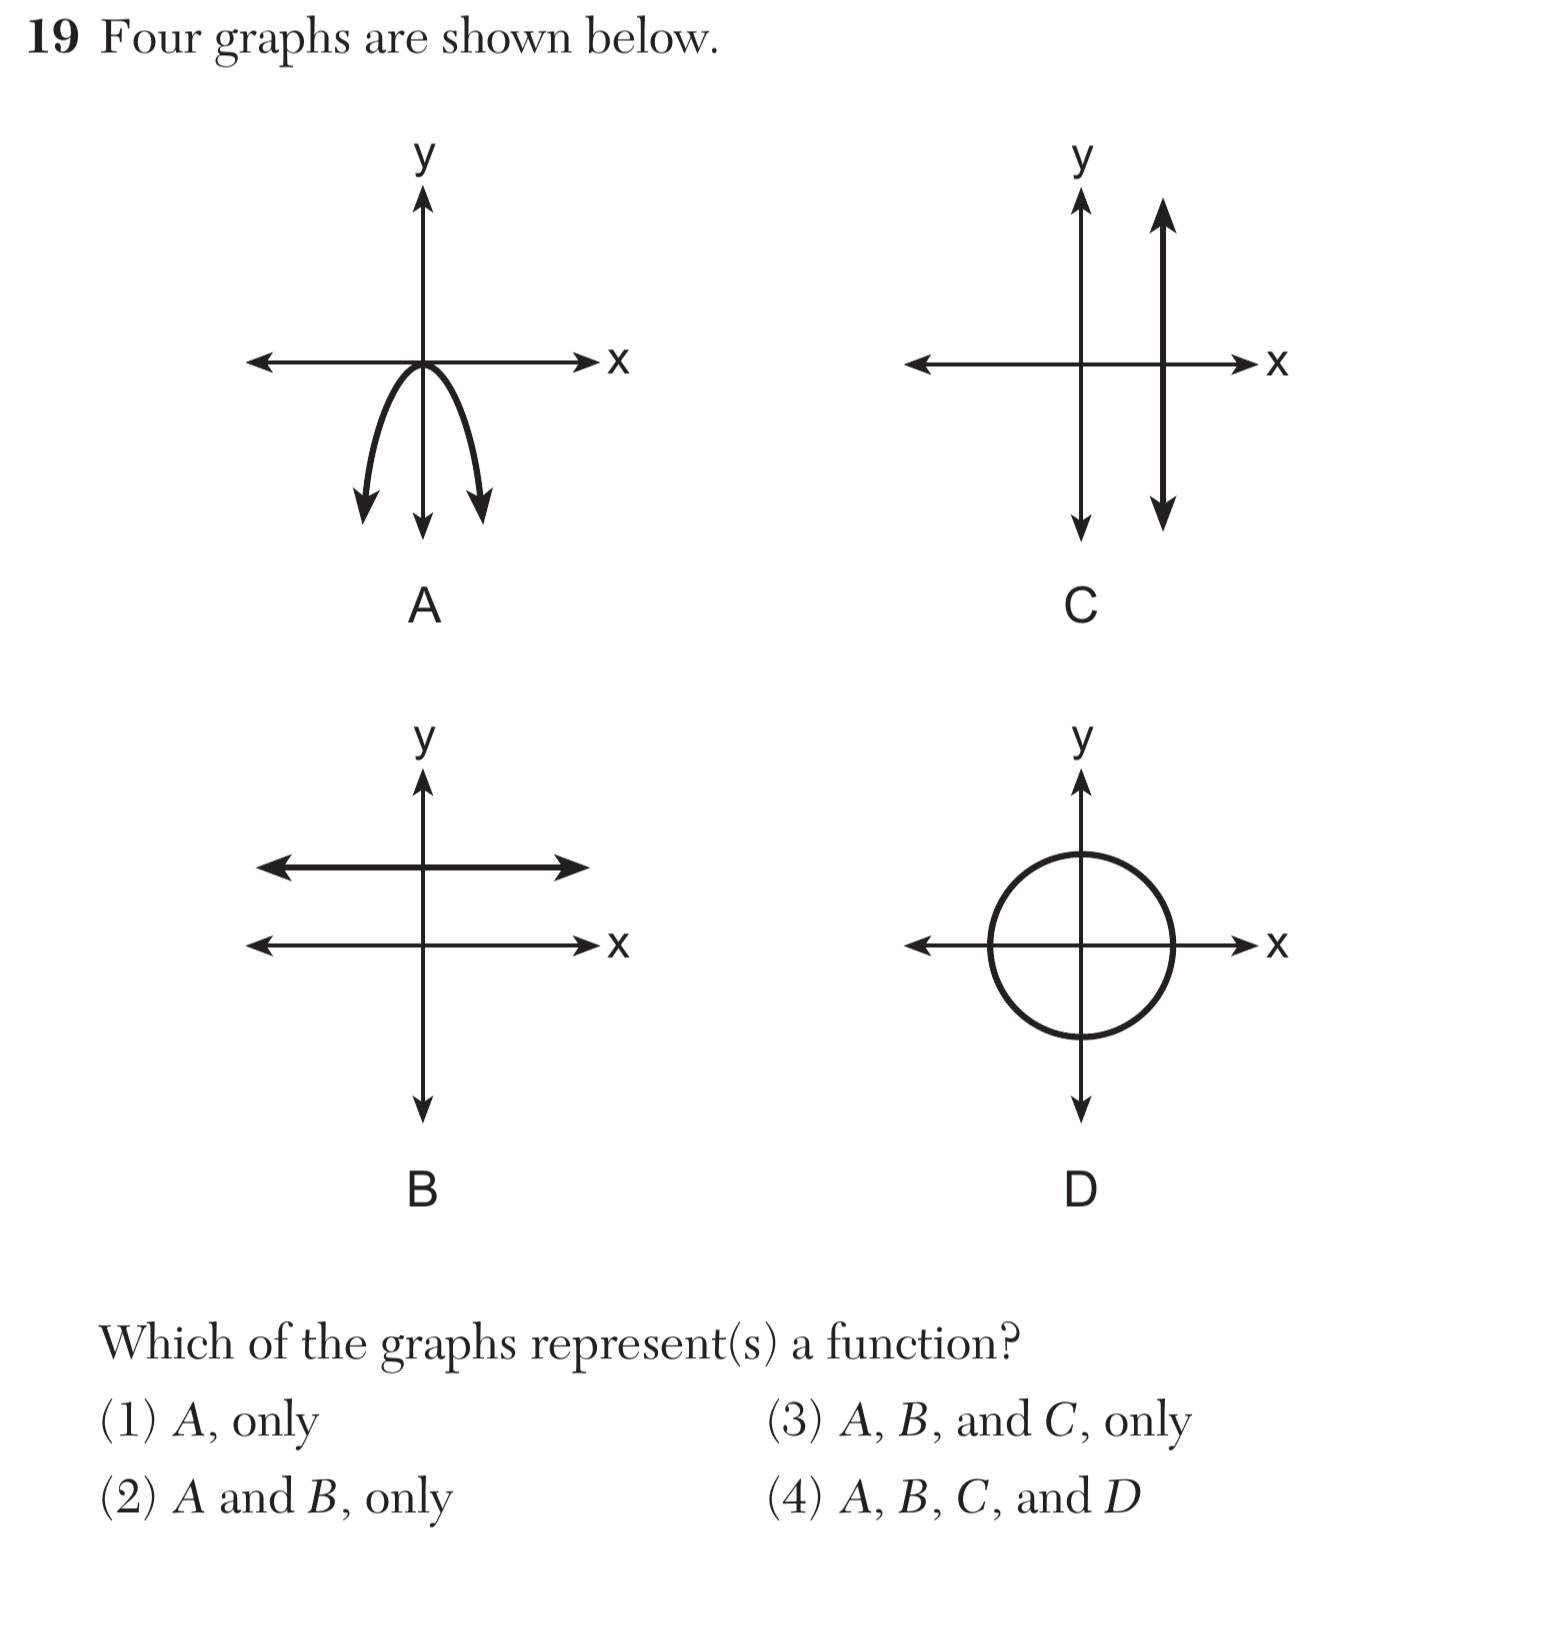
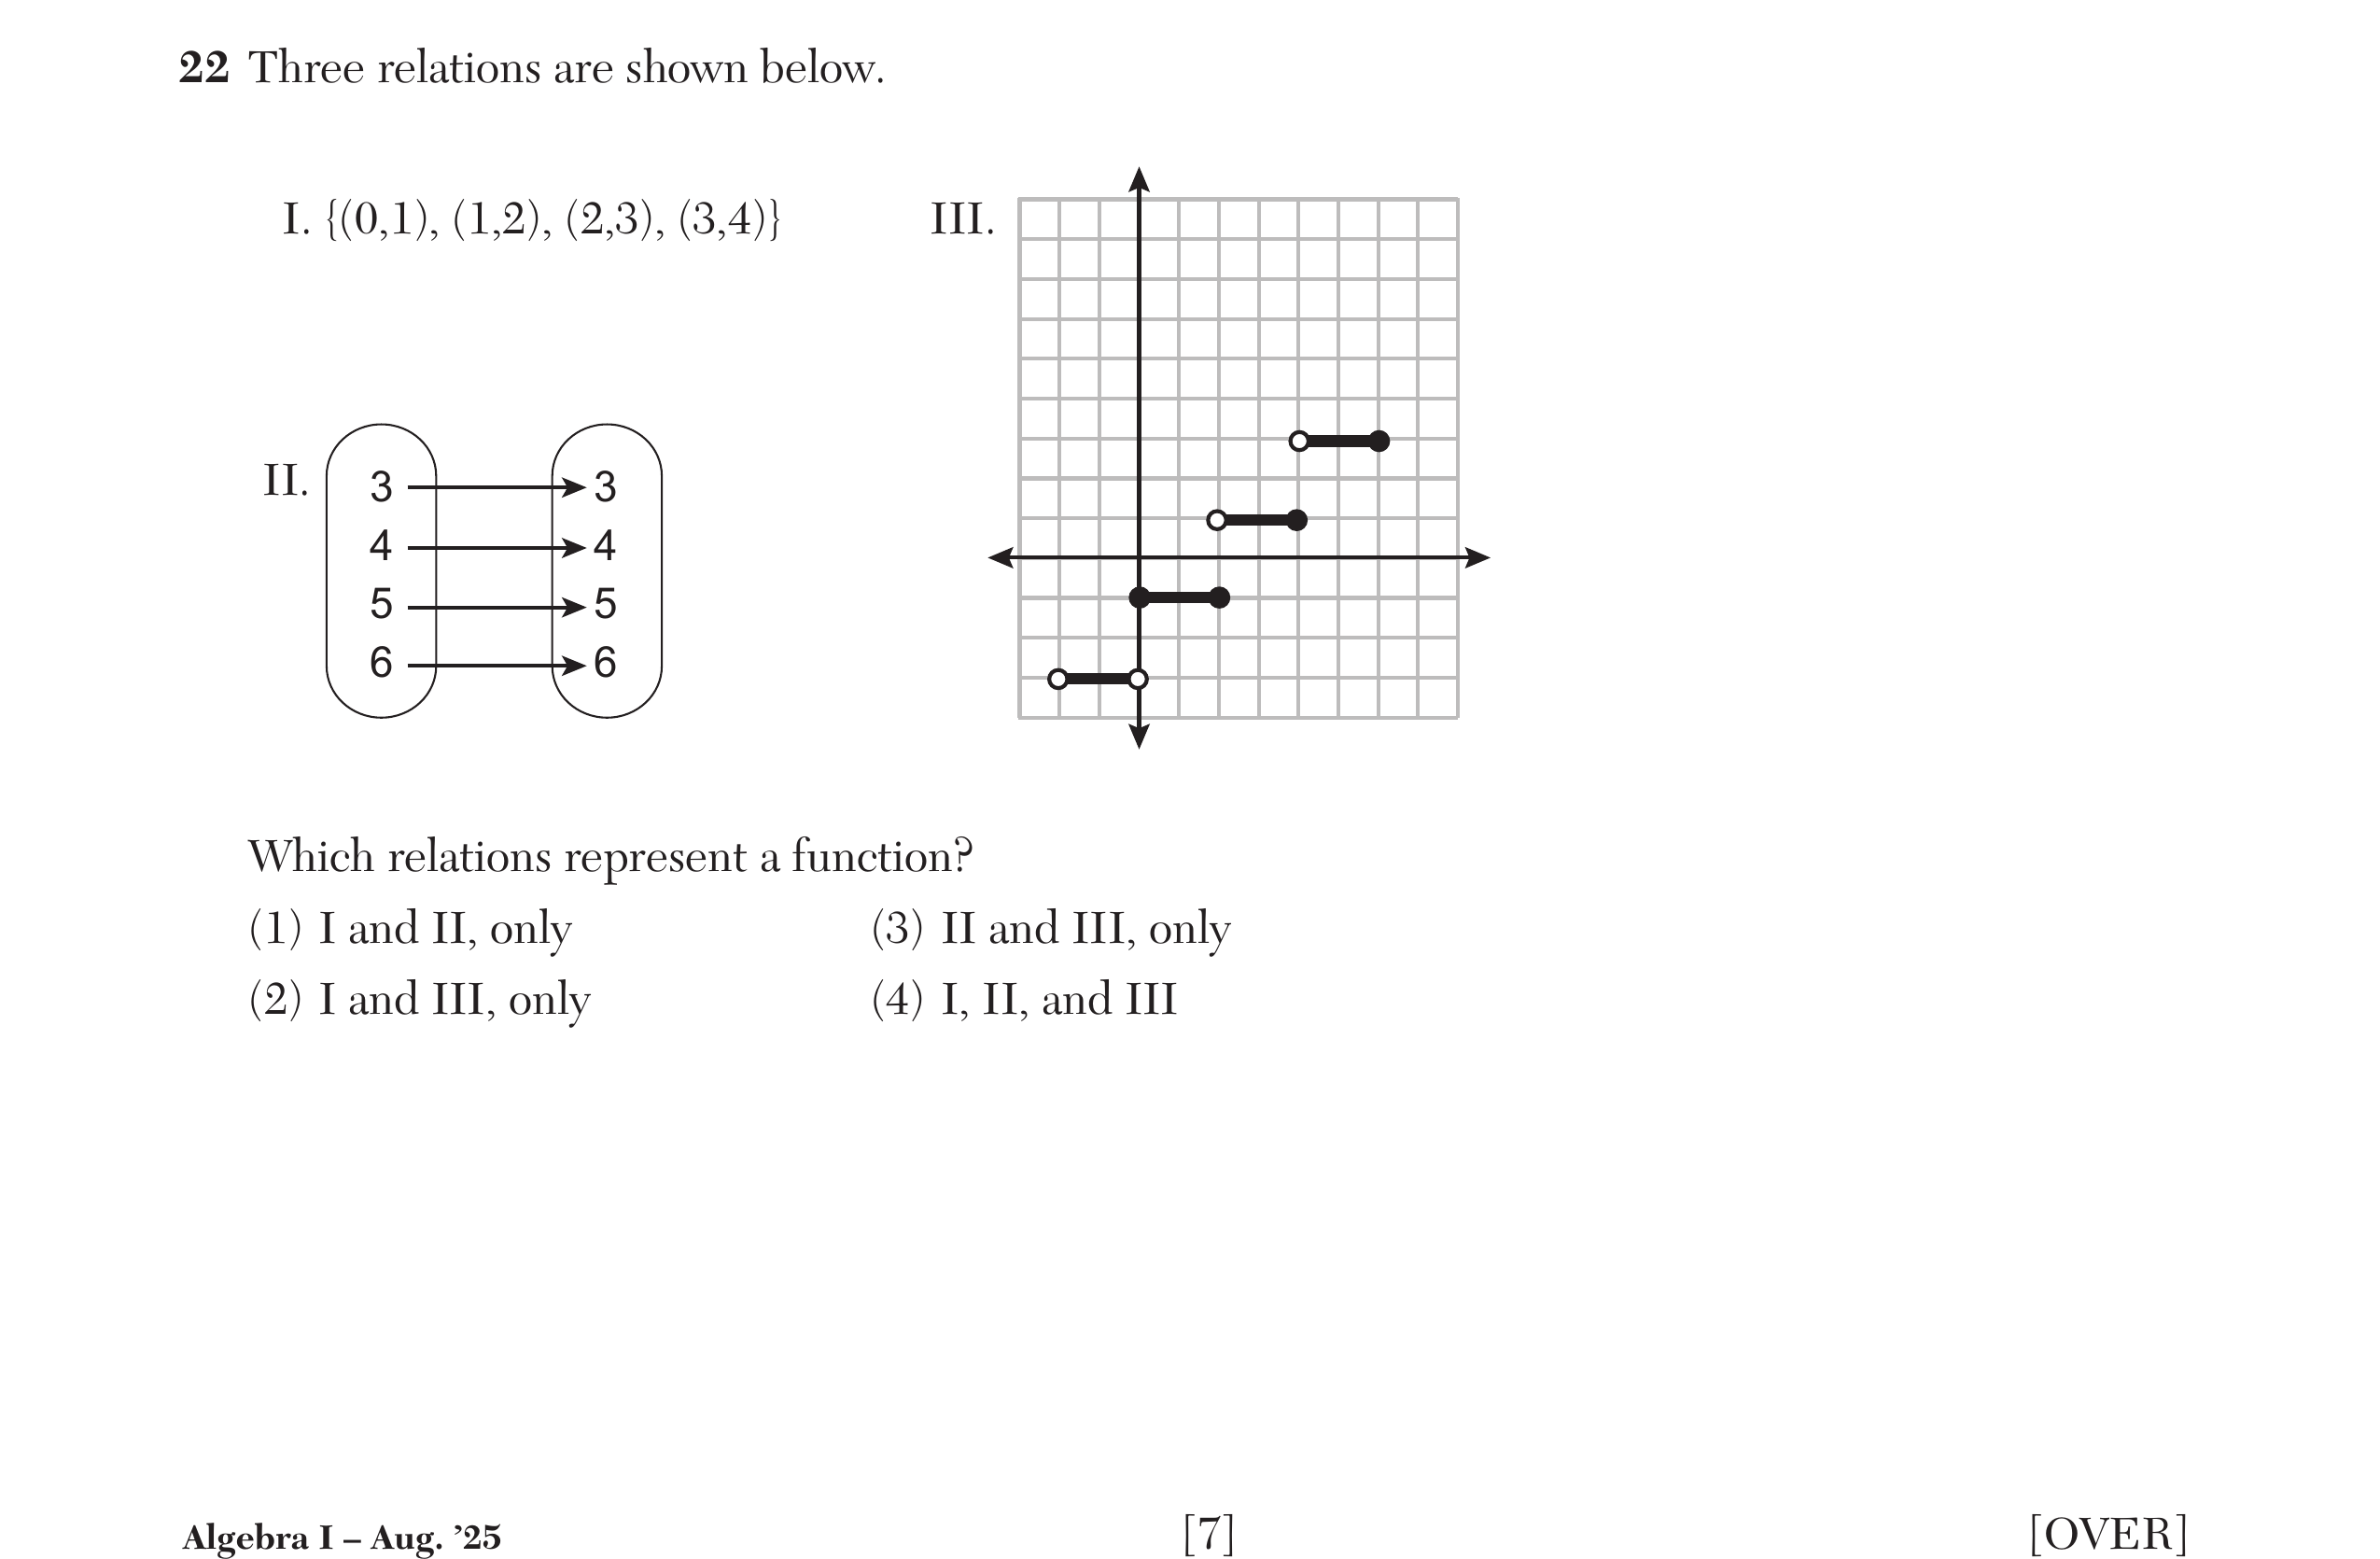
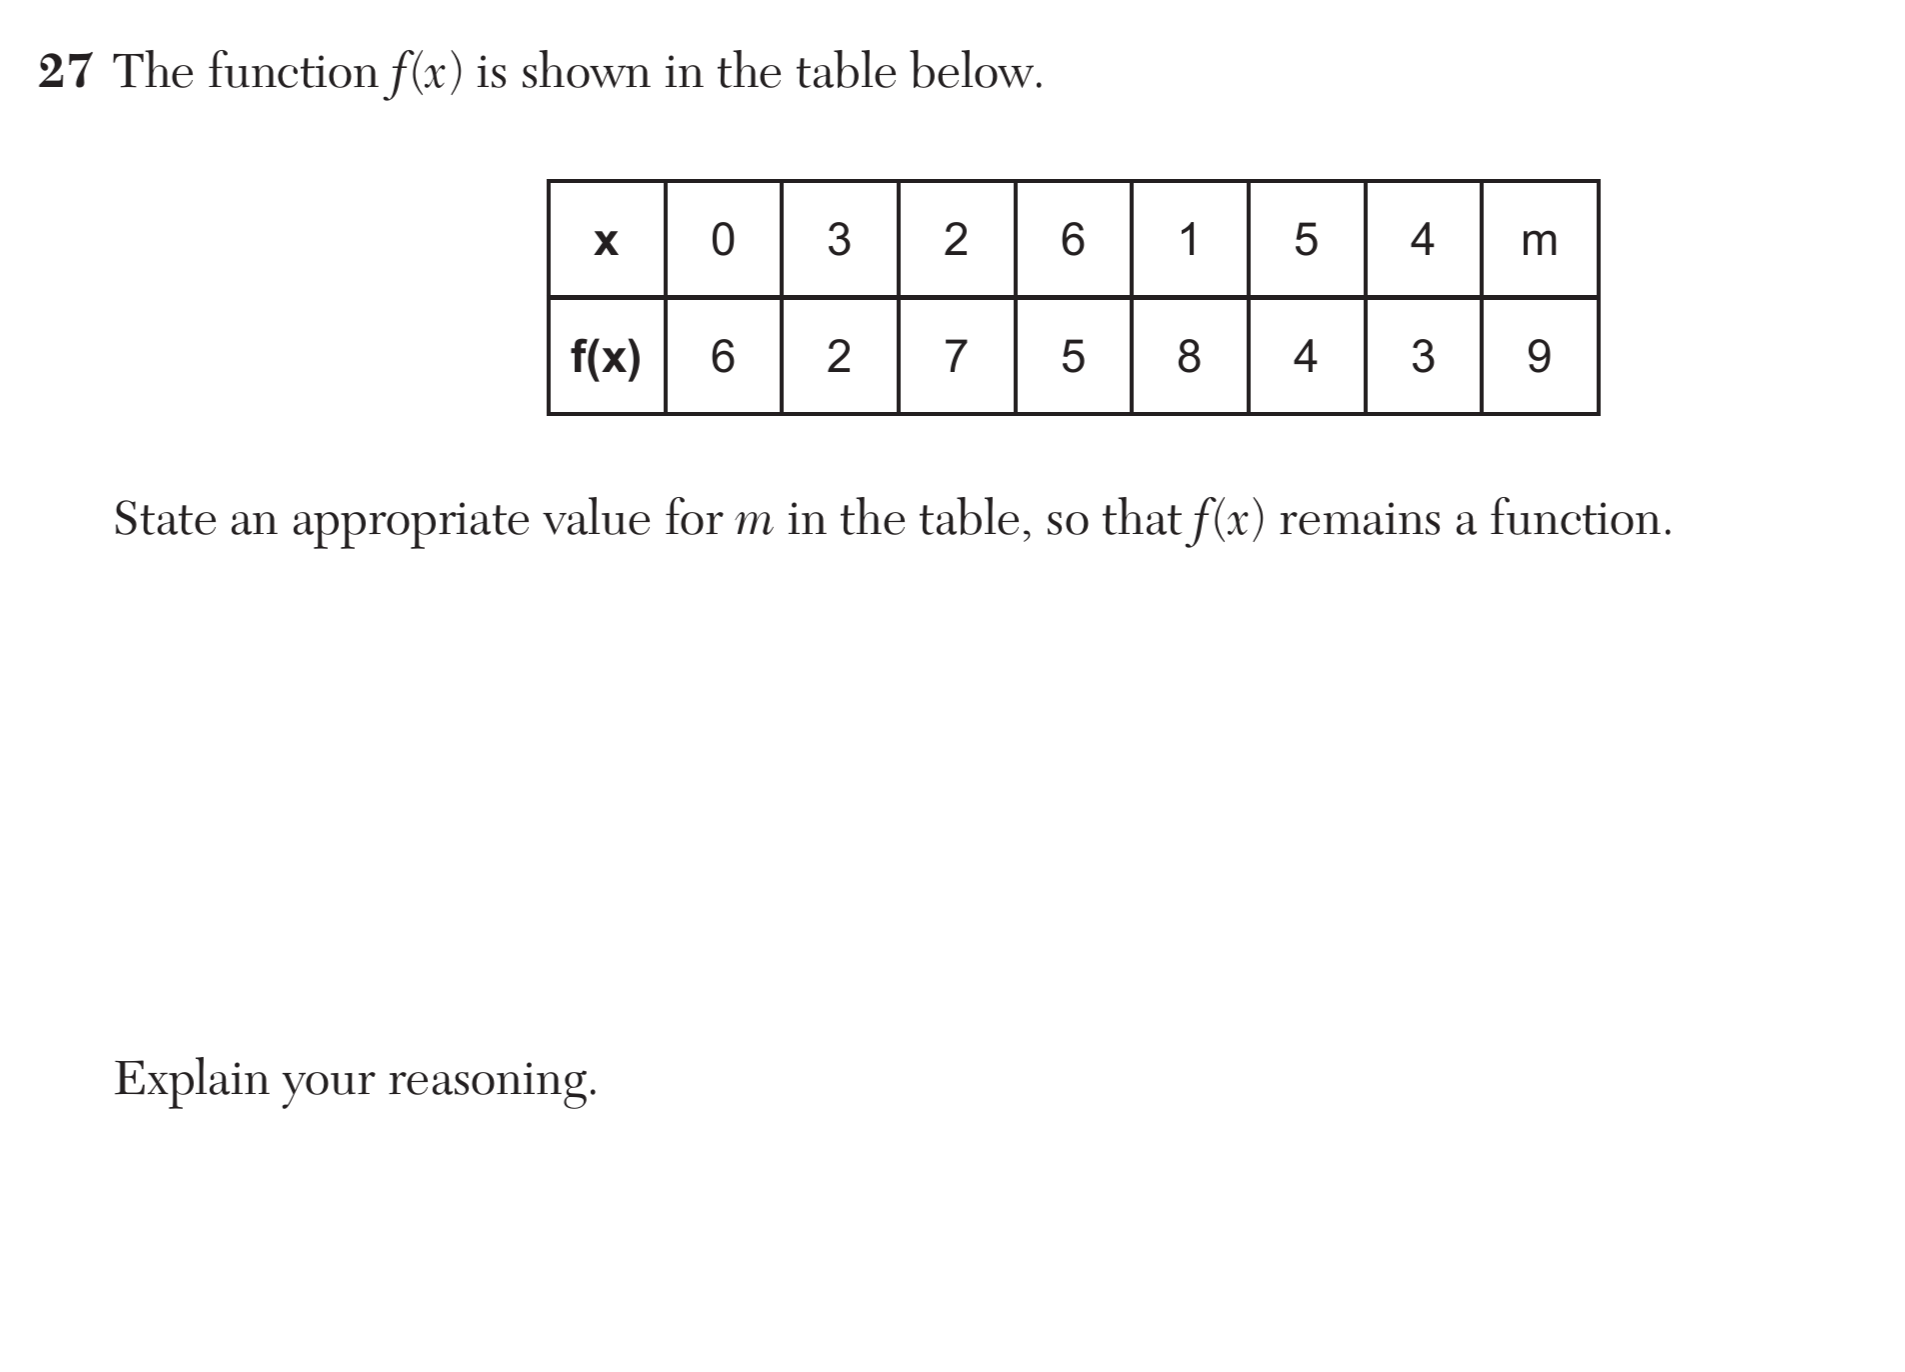
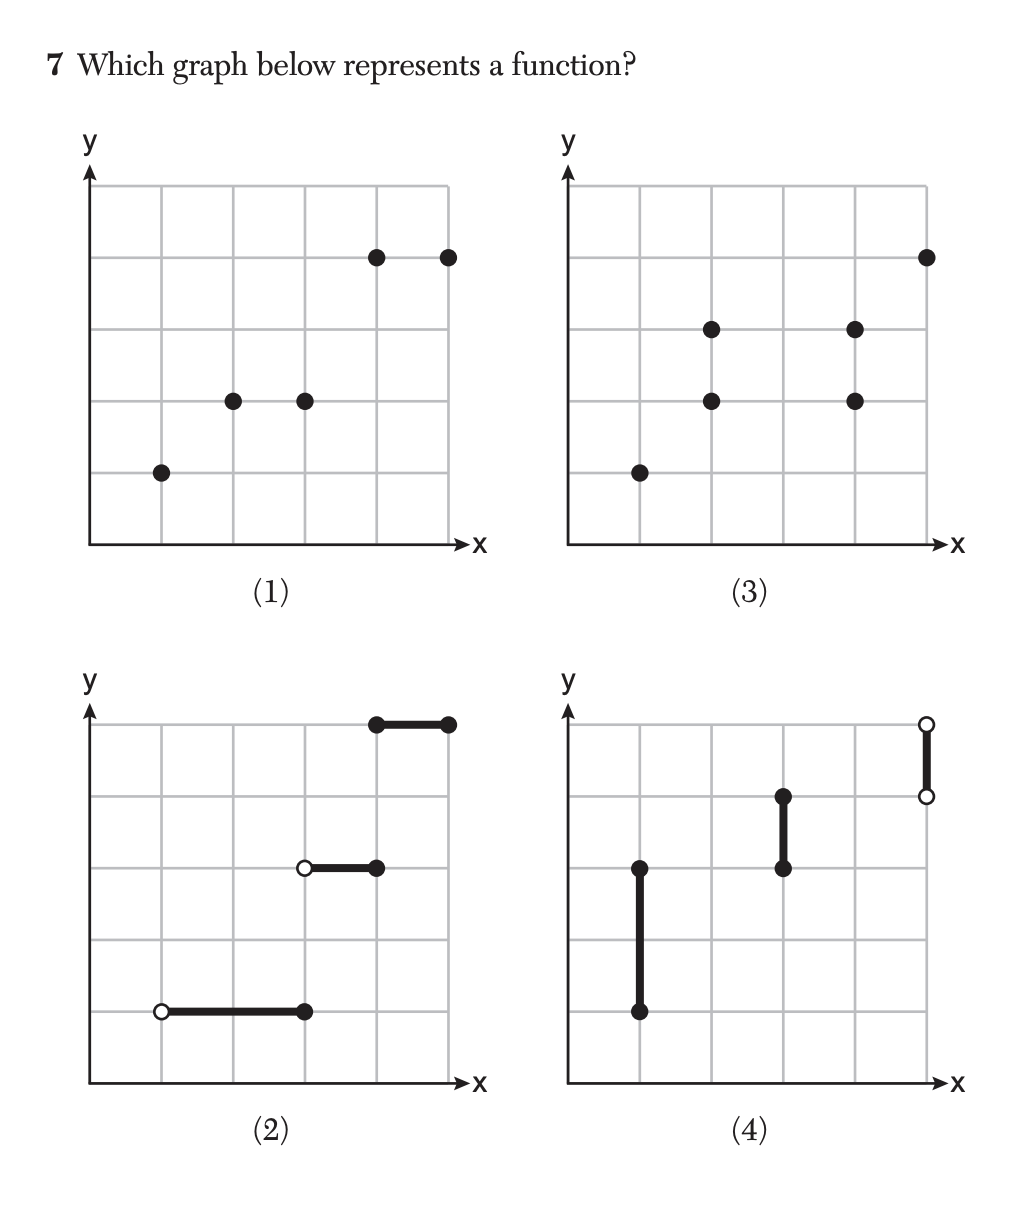
Understand that a function from one set (called the domain) to another set (called the range) assigns to each element of the domain exactly one element of the range.
F-IF.25 questions
Use function notation, evaluate functions for inputs in their domains, and interpret statements that use function notation in terms of a context.
F-IF.17 questions
Understand that a function from one set (called the domain) to another set (called the range) assigns to each element of the domain exactly one element of the range.