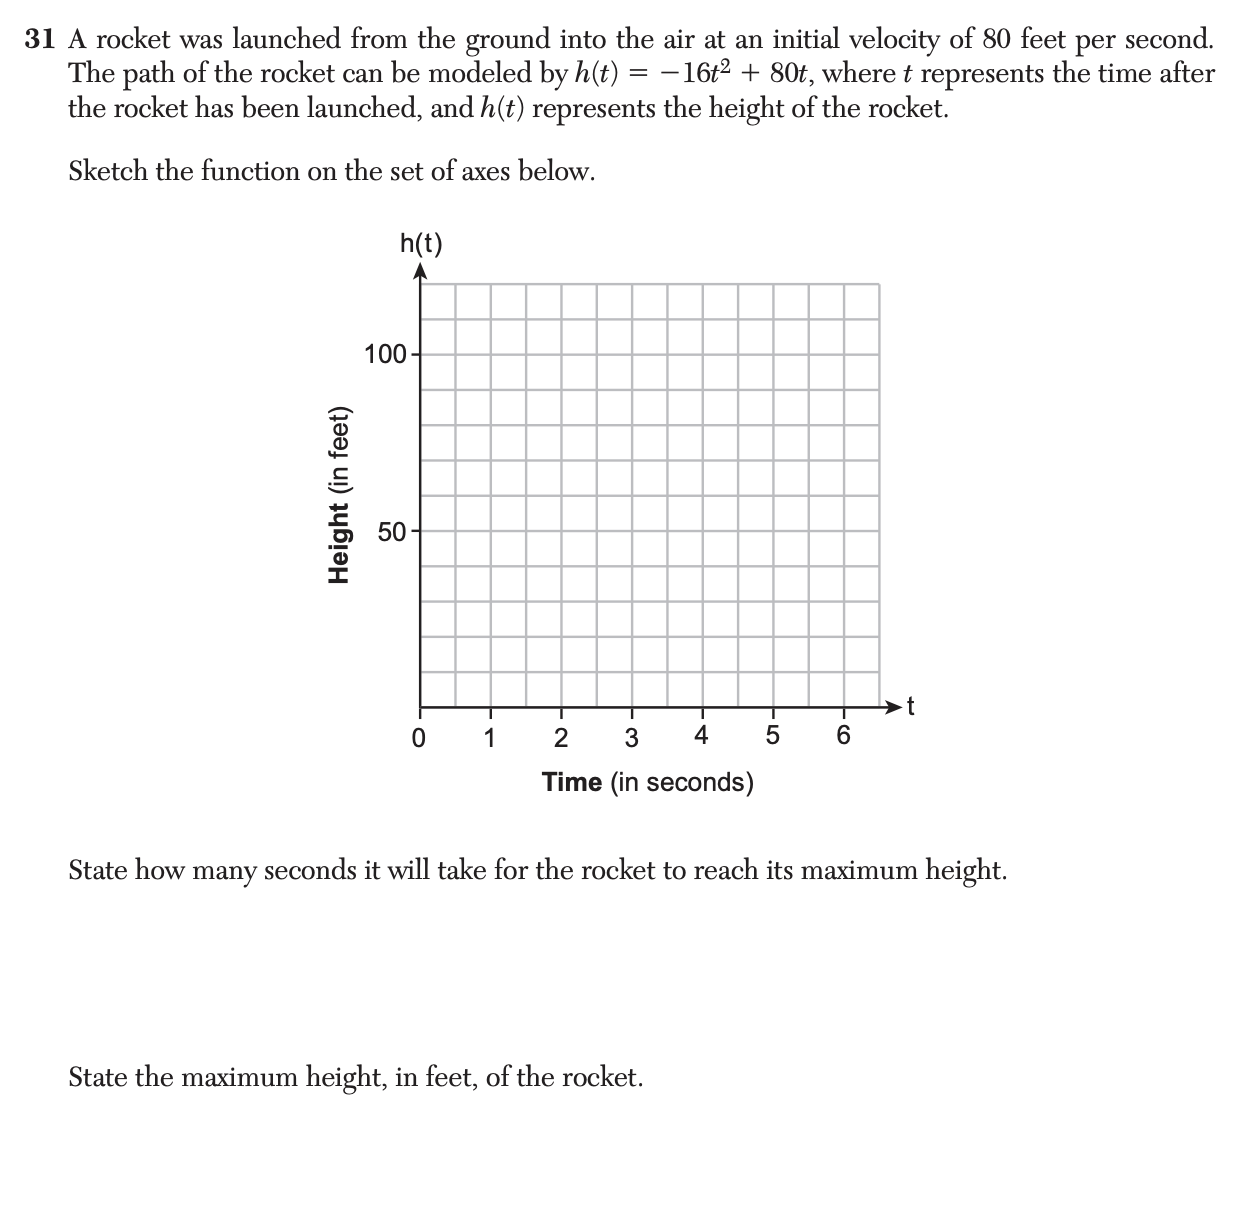
Interpreting and Using Function Notation
Student Summary
What does a statement like p(3)=12 mean?
On its own, p(3)=12 only tells us that when p takes 3 as its input, its output is 12.
If we know what quantities the input and output represent, however, we can learn much more about the situation that the function represents.
-
If function p gives the perimeter of a square whose side length is x and both measurements are in inches, then we can interpret p(3)=12 to mean “a square whose side length is 3 inches has a perimeter of 12 inches.”
We can also interpret statements like p(x)=32 to mean “a square with side length x has a perimeter of 32 inches,” which then allows us to reason that x must be 8 inches and to write p(8)=32.
-
If function p gives the number of blog subscribers, in thousands, x months after a blogger started publishing online, then p(3)=12 means “3 months after a blogger starts publishing online, the blog has 12,000 subscribers.”
It is important to pay attention to the units of measurement when analyzing a function. Otherwise, we might mistake what is happening in the situation. If we miss that p(x) is measured in thousands, we might misinterpret p(x)=36 to mean “there are 36 blog subscribers after x months,” while it actually means “there are 36,000 subscribers after x months.”
A graph of a function can likewise help us interpret statements in function notation.
Function f gives the depth, in inches, of water in a tub as a function of time, t, in minutes, since the tub started being drained.
Here is a graph of f.
Each point on the graph has the coordinates (t,f(t)), where the first value is the input of the function and the second value is the output.
-
f(2) represents the depth of water 2 minutes after the tub started being drained. The graph passes through (2,5), so the depth of water is 5 inches when t=2. The equation f(2)=5 captures this information.
-
f(0) gives the depth of the water when the draining began, when t=0. The graph shows the depth of water to be 6 inches at that time, so we can write f(0)=6.
-
f(t)=3 tells us that t minutes after the tub started draining, the depth of the water is 3 inches. The graph shows that this happens when t is 6.
Visual / Anchor Chart

Standards
F-IF.25 questions
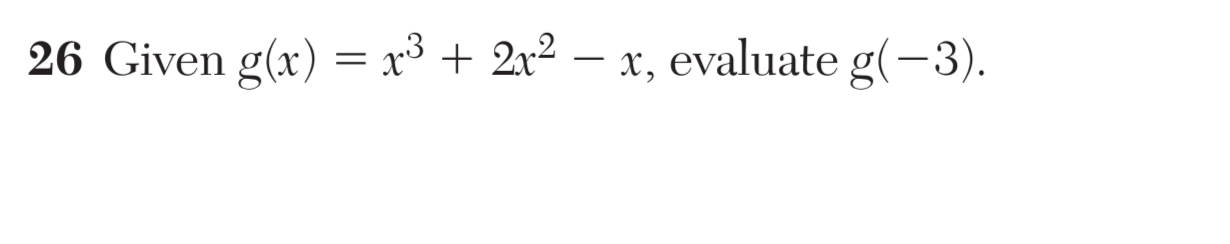
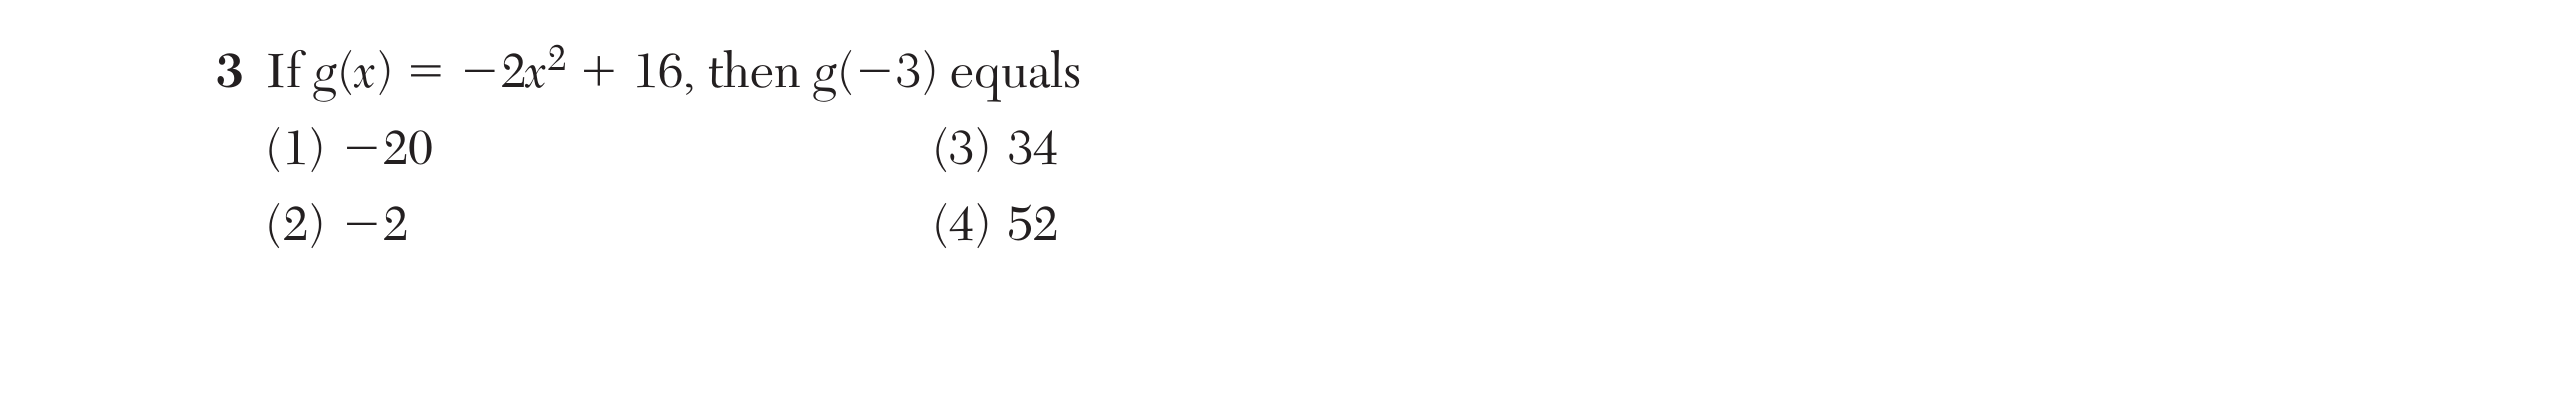
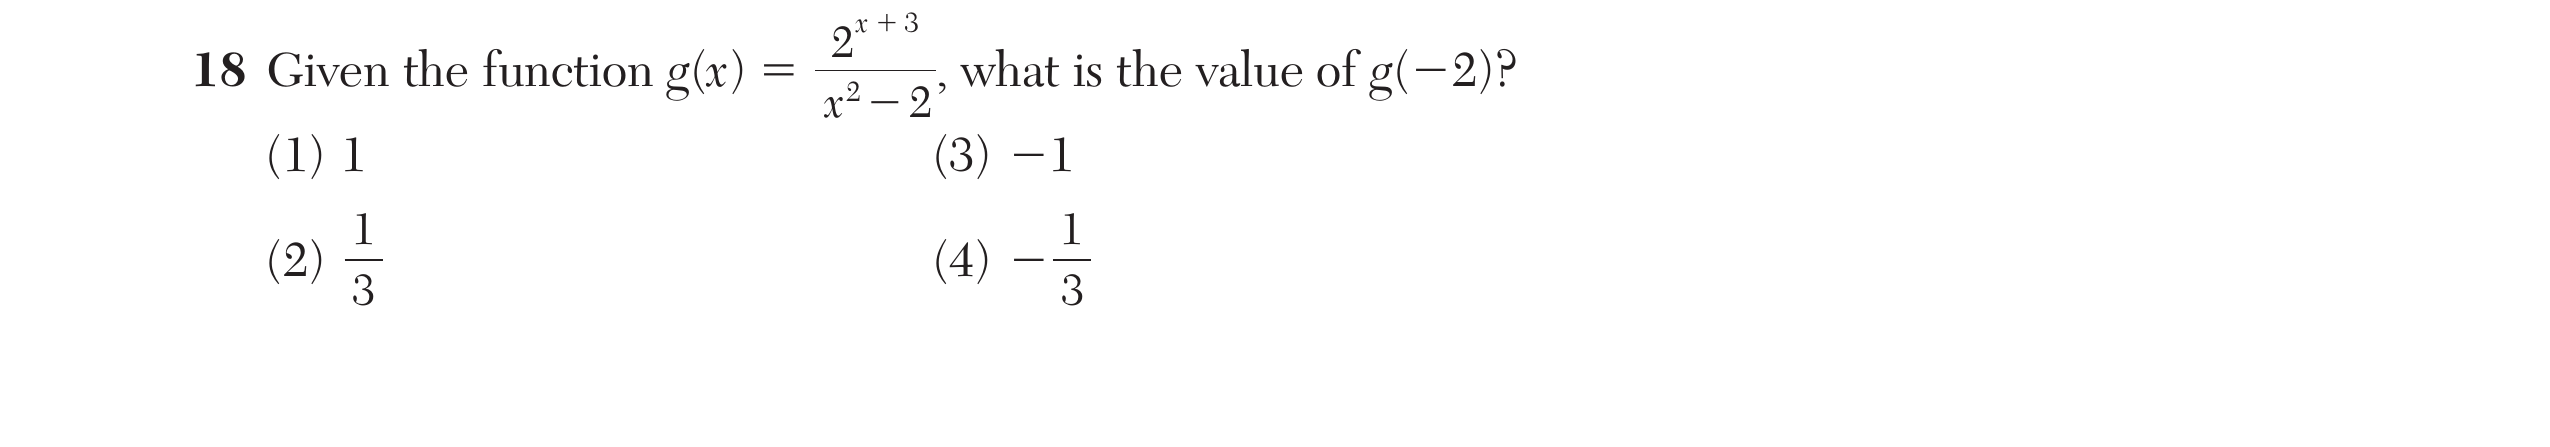
Use function notation, evaluate functions for inputs in their domains, and interpret statements that use function notation in terms of a context.
F-IF.45 questions
For a function that models a relationship between two quantities: i) interpret key features of graphs and tables in terms of the quantities; and ii) sketch graphs showing key features given a verbal description of the relationship.