Reasoning about Exponential Graphs (Part 1)
Student Summary
An exponential function can give us information about a graph that represents it.
For example, suppose that function q represents a bacteria population t hours after it is first measured, and q(t)=5,000⋅(1.5)t. The number 5,000 is the bacteria population measured, when t is 0. The number 1.5 indicates that the bacteria population increases by a factor of 1.5 each hour.
A graph can help us see how the starting population (5,000) and growth factor (1.5) influence the population. Suppose functions p and r represent two other bacteria populations and are given by p(t)=5,000⋅2t and r(t)=5,000⋅(1.2)t. Here are the graphs of p, q, and r.
All three graphs start at 5,000, but the graph of r grows more slowly than does the graph of q, while the graph of p grows more quickly. This makes sense because a population that doubles every hour is growing more quickly than one that increases by a factor of 1.5 each hour, and both grow more quickly than a population that increases by a factor of 1.2 each hour.
Visual / Anchor Chart

Standards
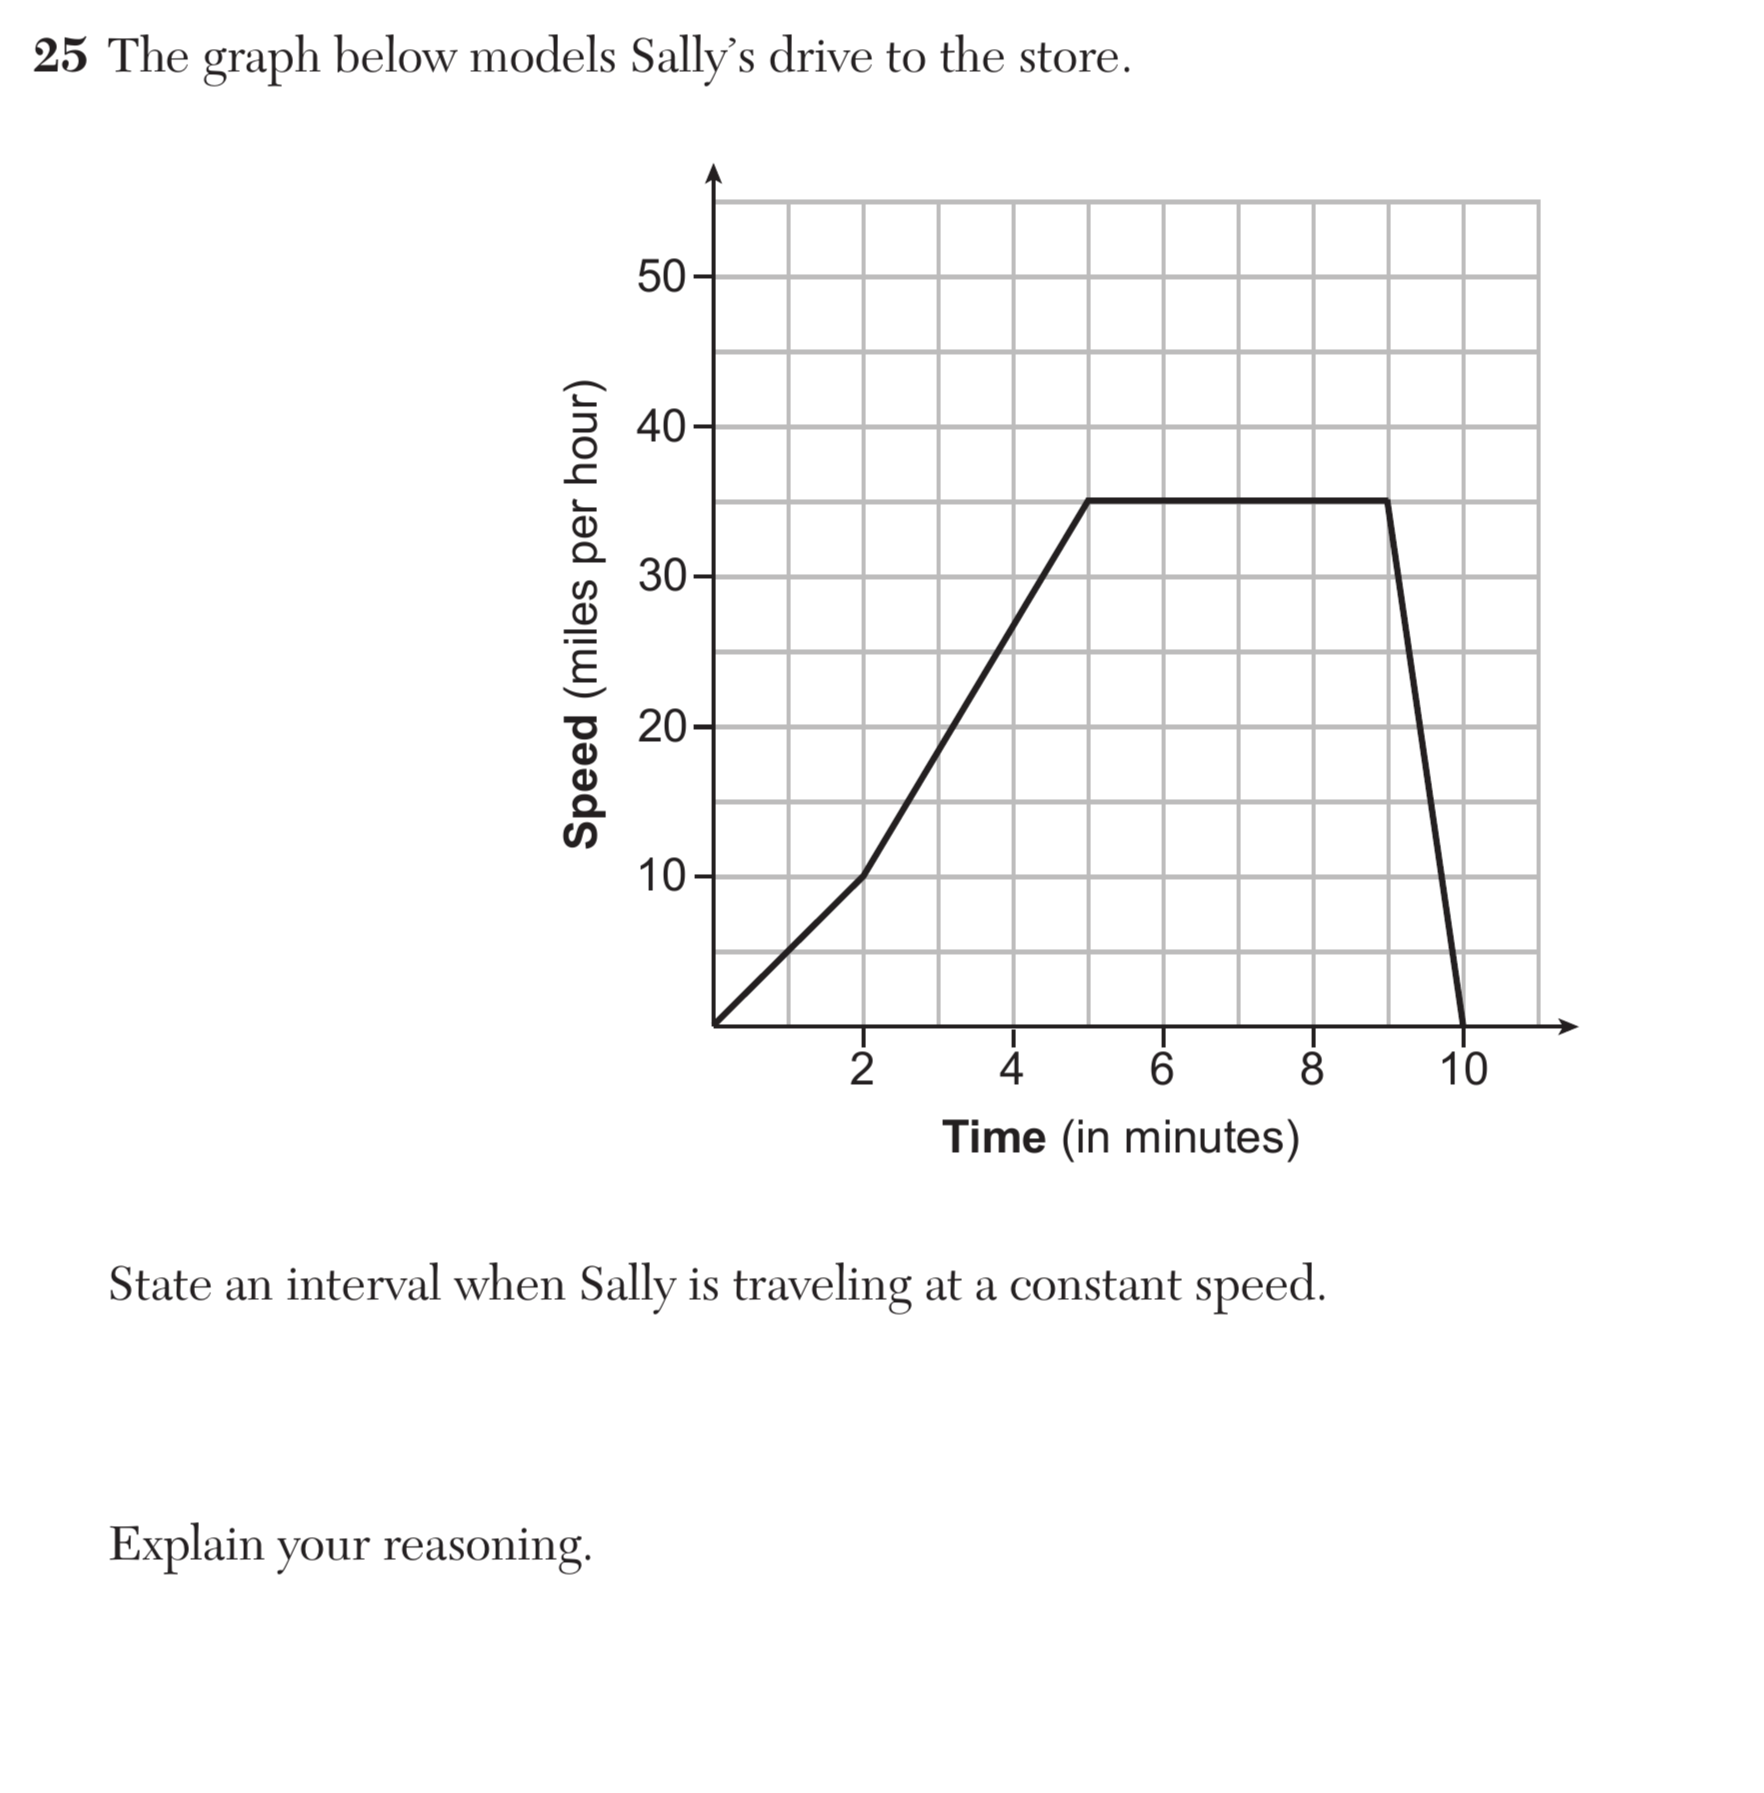
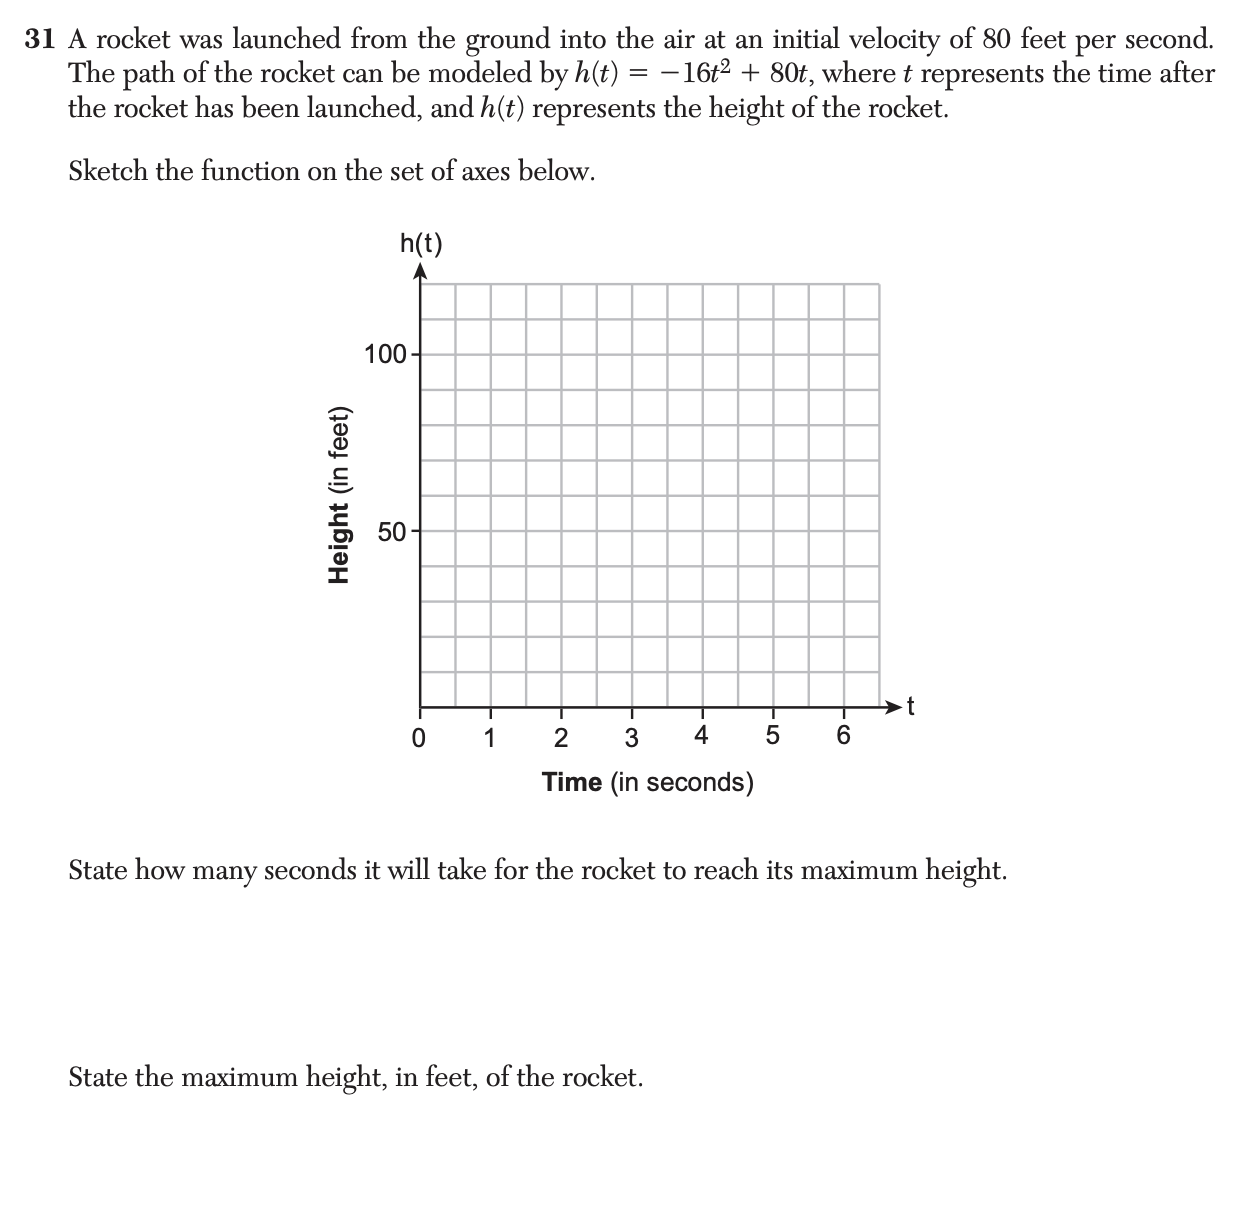
F-LE.53 questions
F-IF.45 questions
For a function that models a relationship between two quantities: i) interpret key features of graphs and tables in terms of the quantities; and ii) sketch graphs showing key features given a verbal description of the relationship.
F-IF.92 questions
Compare properties of two functions each represented in a different way (algebraically, graphically, numerically in tables, or by verbal descriptions).