Which One Changes Faster?
Student Summary
Suppose that you won the top prize from a game show and are given two options. The first option is a cash gift of $10,000 and $1,000 is added per day for the next 7 days. The second option is a cash gift of 1 cent (or $0.01) that grows tenfold each day for 7 days. You must wait the entire time and get all of the prize money at the end of the week. Which option would you choose?
In the first option, the amount of money increases by the same amount ($1,000) each day, so we can represent it with a linear function. In the second option, the money grows by multiples of 10, so we can represent it with an exponential function. Let f represent the amount of money x days after winning with the first option, and let g represent the amount of money x days after winning with the second option.
Option 1: f(x)=10,000+1,000x
f(1)=11,000
f(2)=12,000
f(3)=13,000
. . .
f(6)=16,000
f(7)=17,000
Option 2: g(x)=(0.01)⋅10x
g(1)=0.1
g(2)=1
g(3)=10
. . .
g(6)=10,000
g(7)=100,000
For the first few days, the second option trails far behind the first. Because of the repeated multiplication by 10, however, after 7 days it surges past the amount in the first option.
What if the factor of growth is much smaller than 10? Suppose we have a third option, represented by a function h. The starting amount is still $0.01 and it grows by a factor of 1.5 times each day.
If we graph the function h(x)=(0.01)⋅(1.5)x, we see that it takes many, many more days before we see rapid growth. But given time to continue growing, the amount in this exponential option will eventually also outpace that in the linear option. If the prize rules are changed so that both prizes can grow for more than 38 days, this new exponential prize may be worth more than the linear option, but if the prizes can grow for only a shorter amount of time, the linear option is worth more.
Visual / Anchor Chart

Standards
F-IF.45 questions
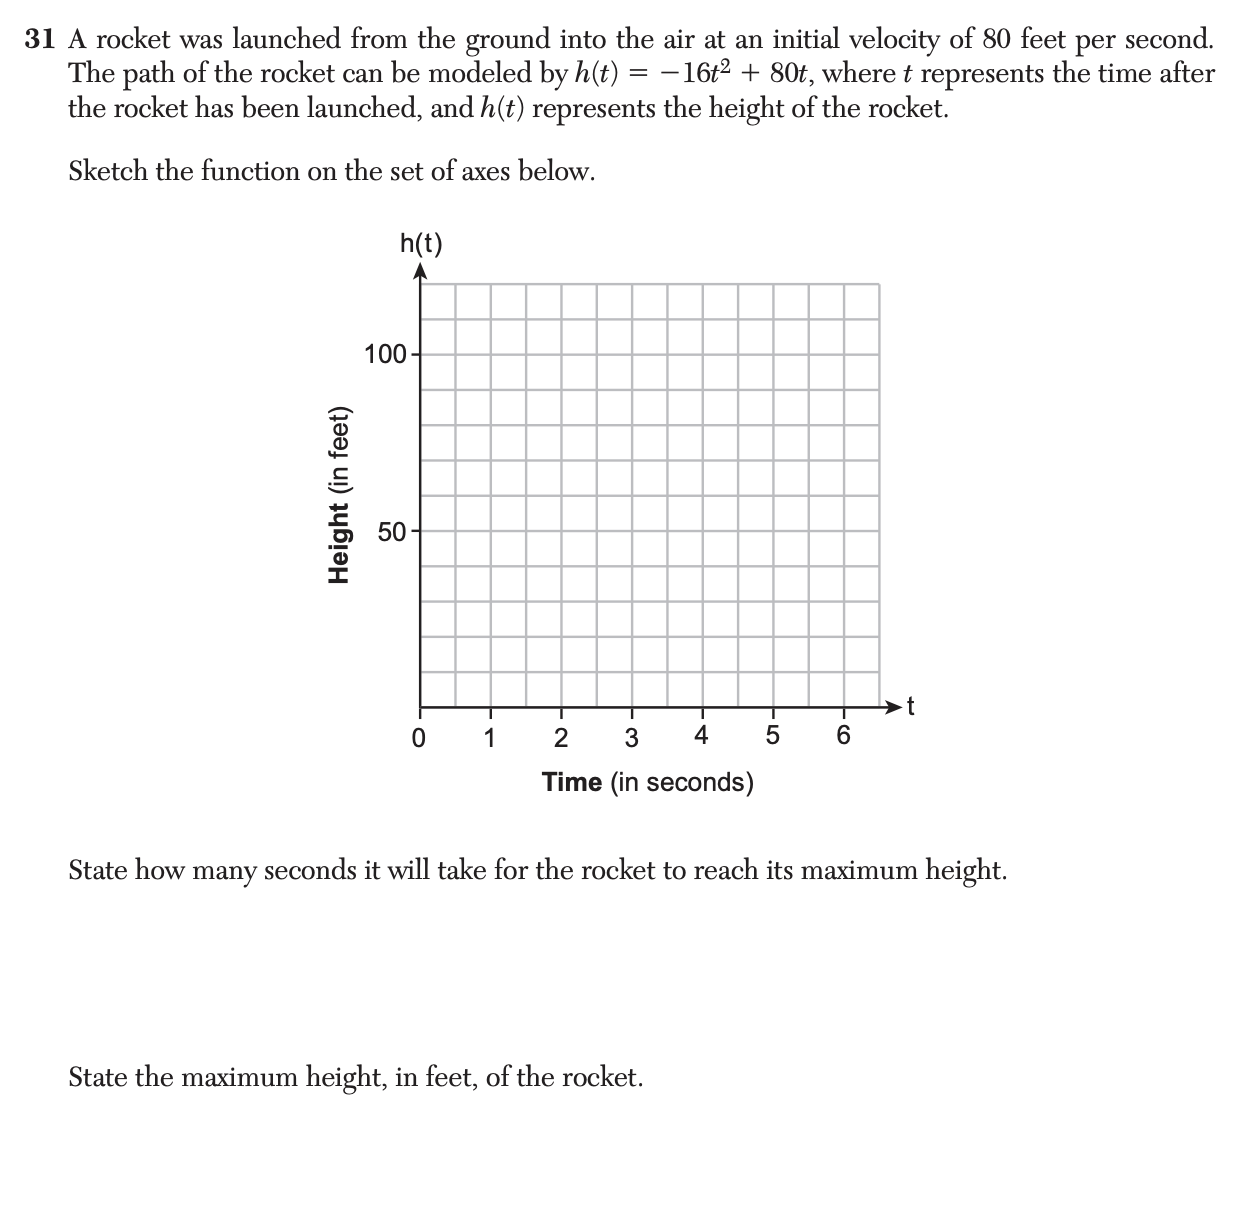
For a function that models a relationship between two quantities: i) interpret key features of graphs and tables in terms of the quantities; and ii) sketch graphs showing key features given a verbal description of the relationship.
F-IF.52 questions
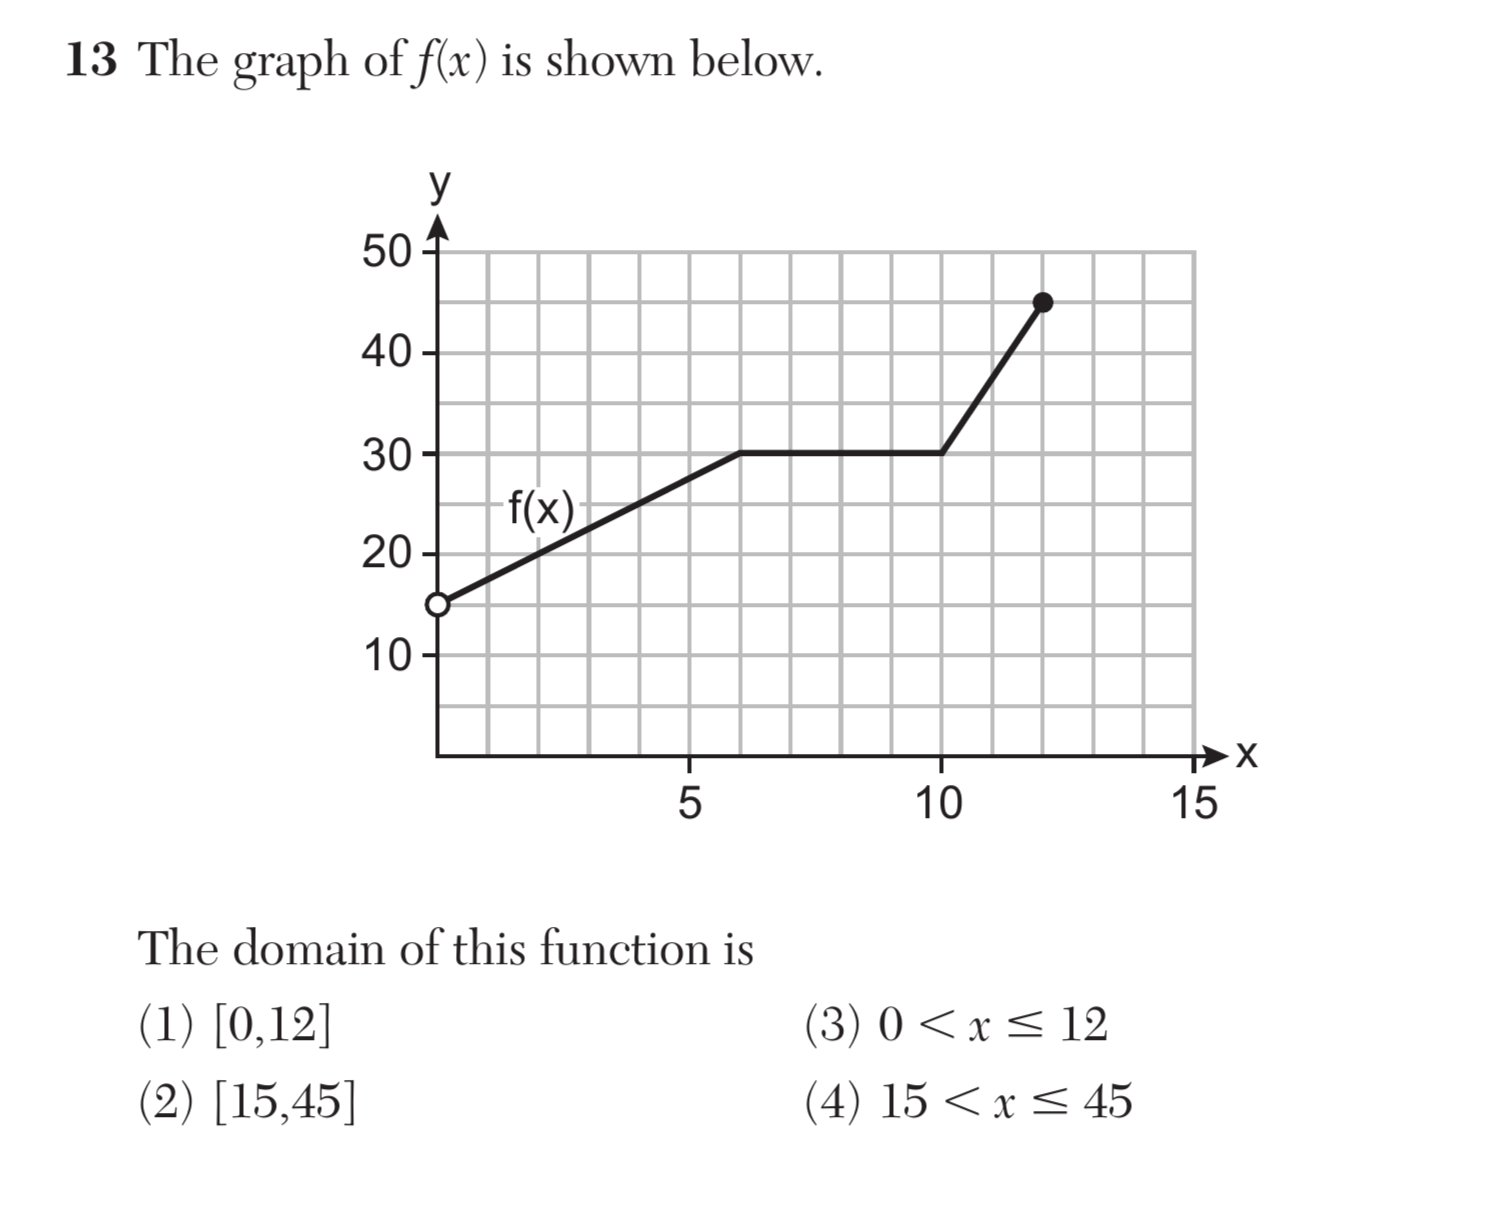
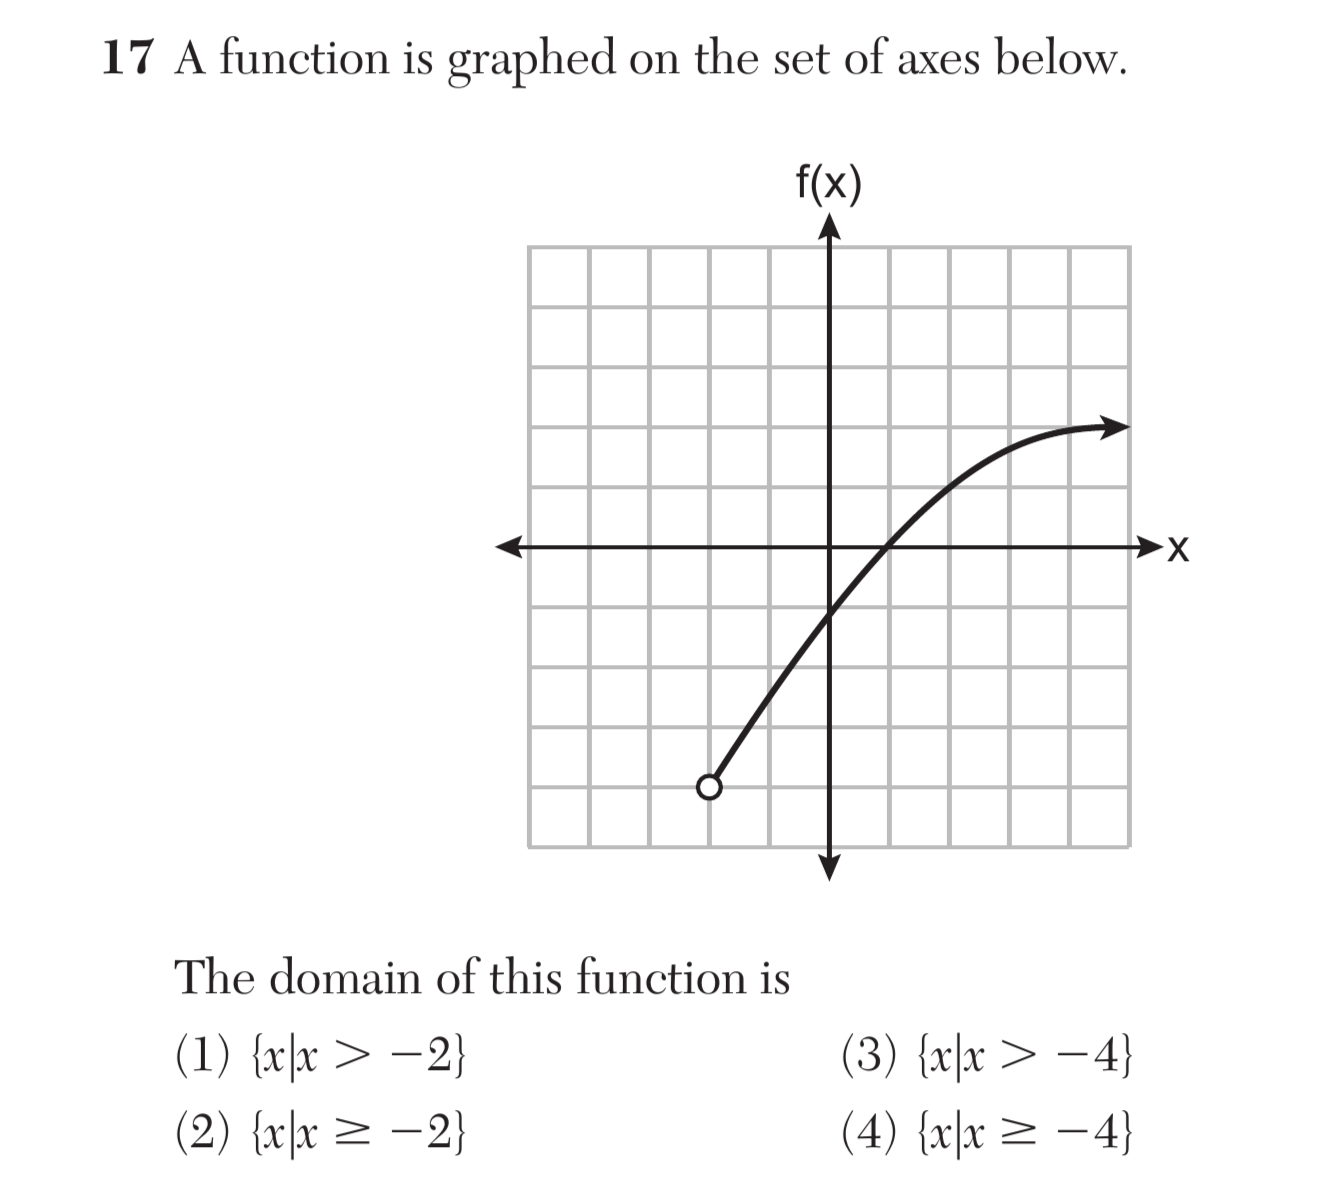
Determine the domain of a function from its graph and, where applicable, identify the appropriate domain for a function in context.
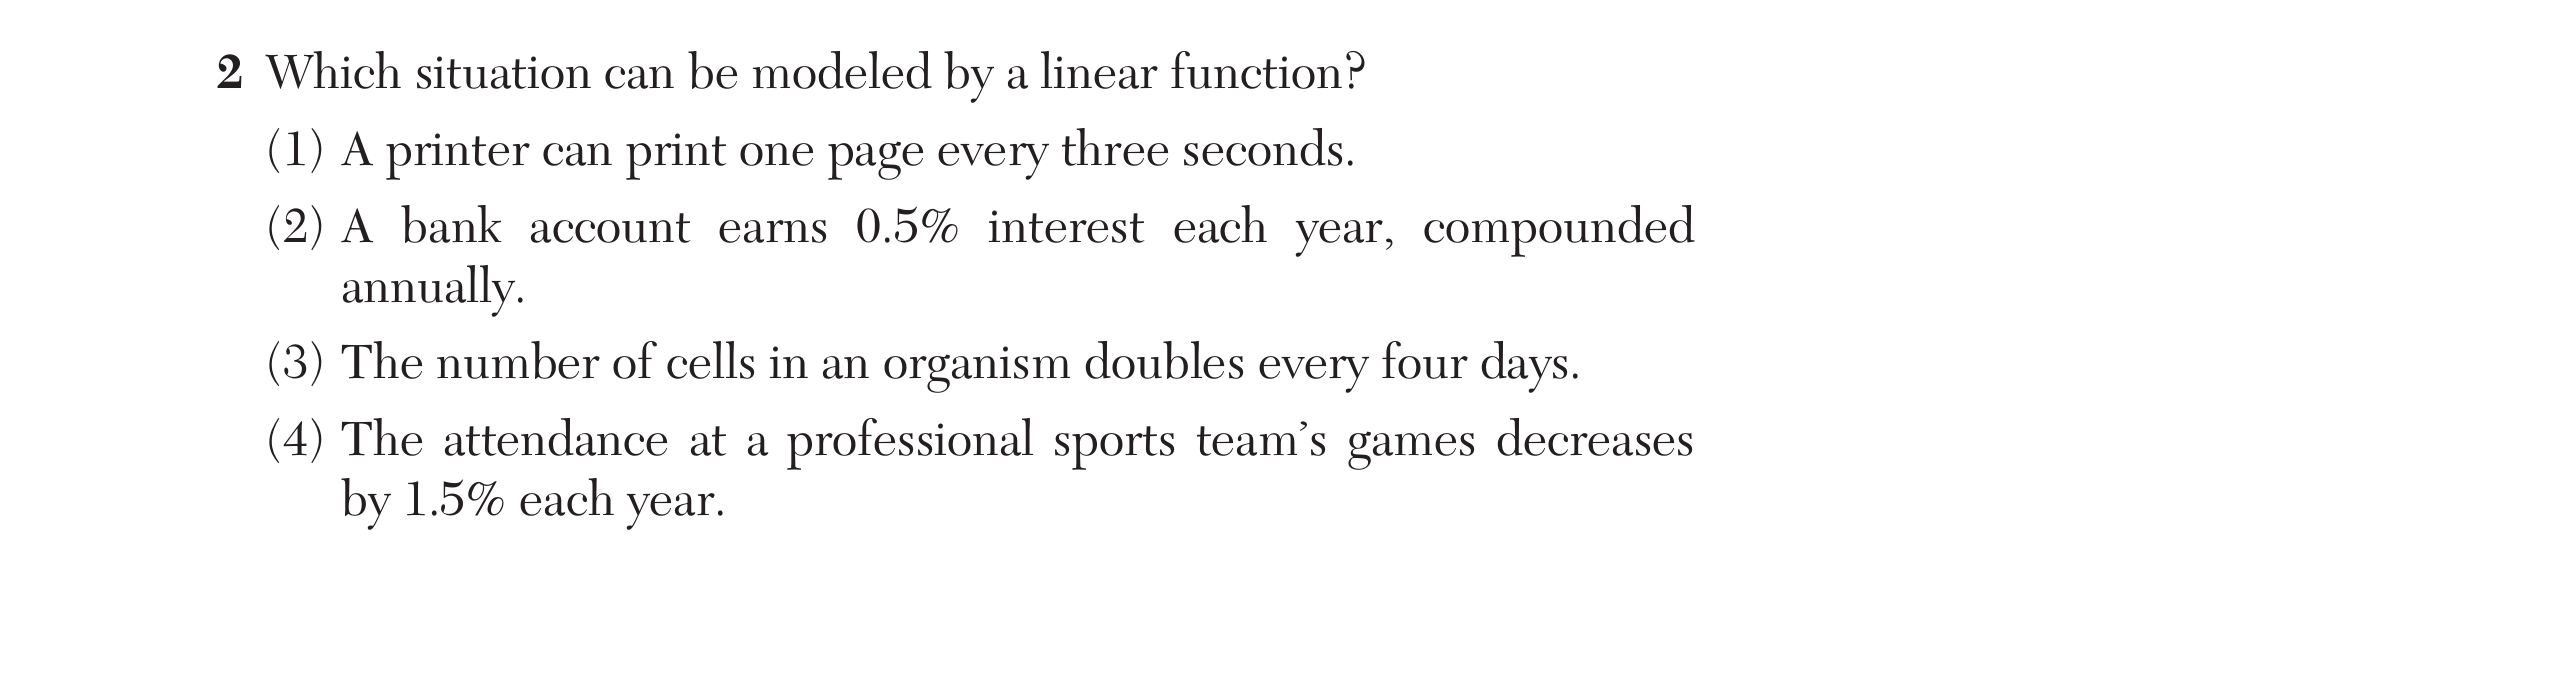
F-LE.16 questions
F-LE.21 question
F-LE.31 question
F-IF.25 questions
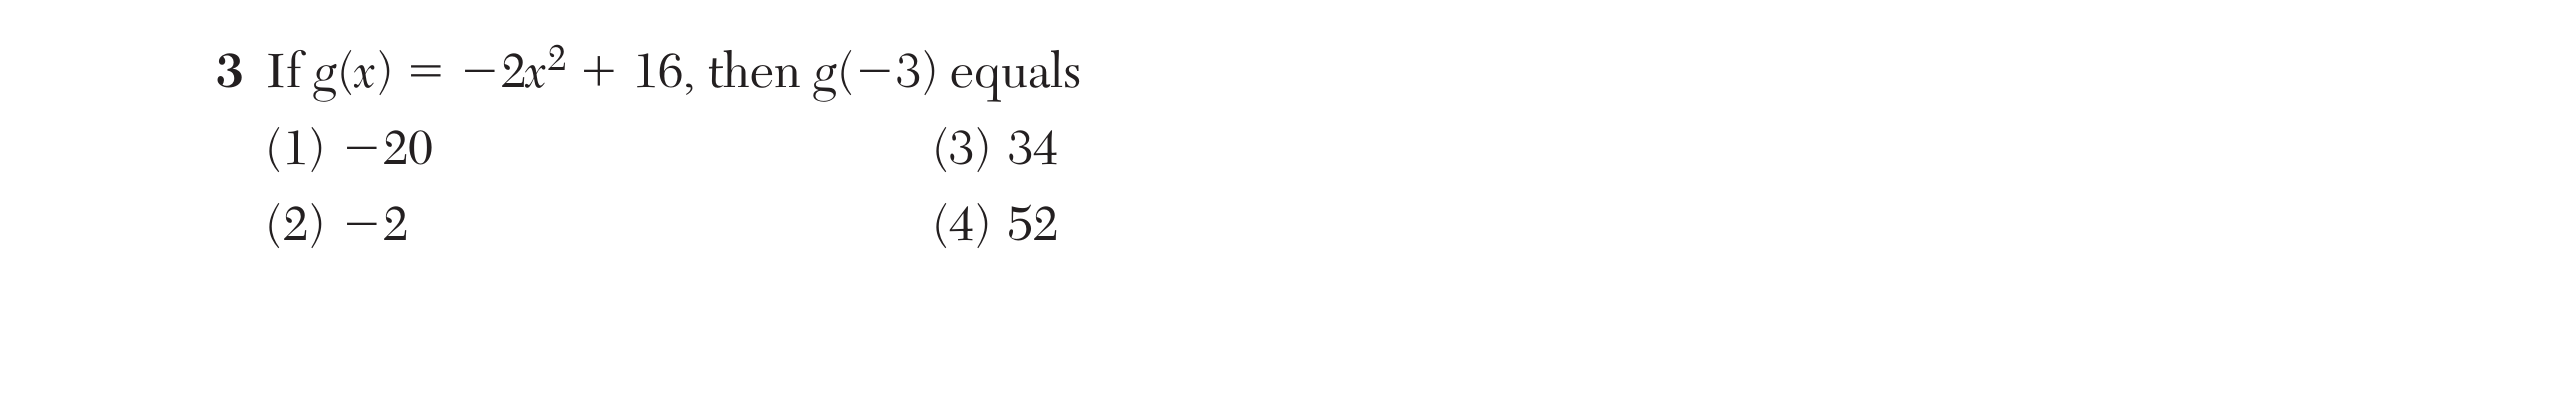
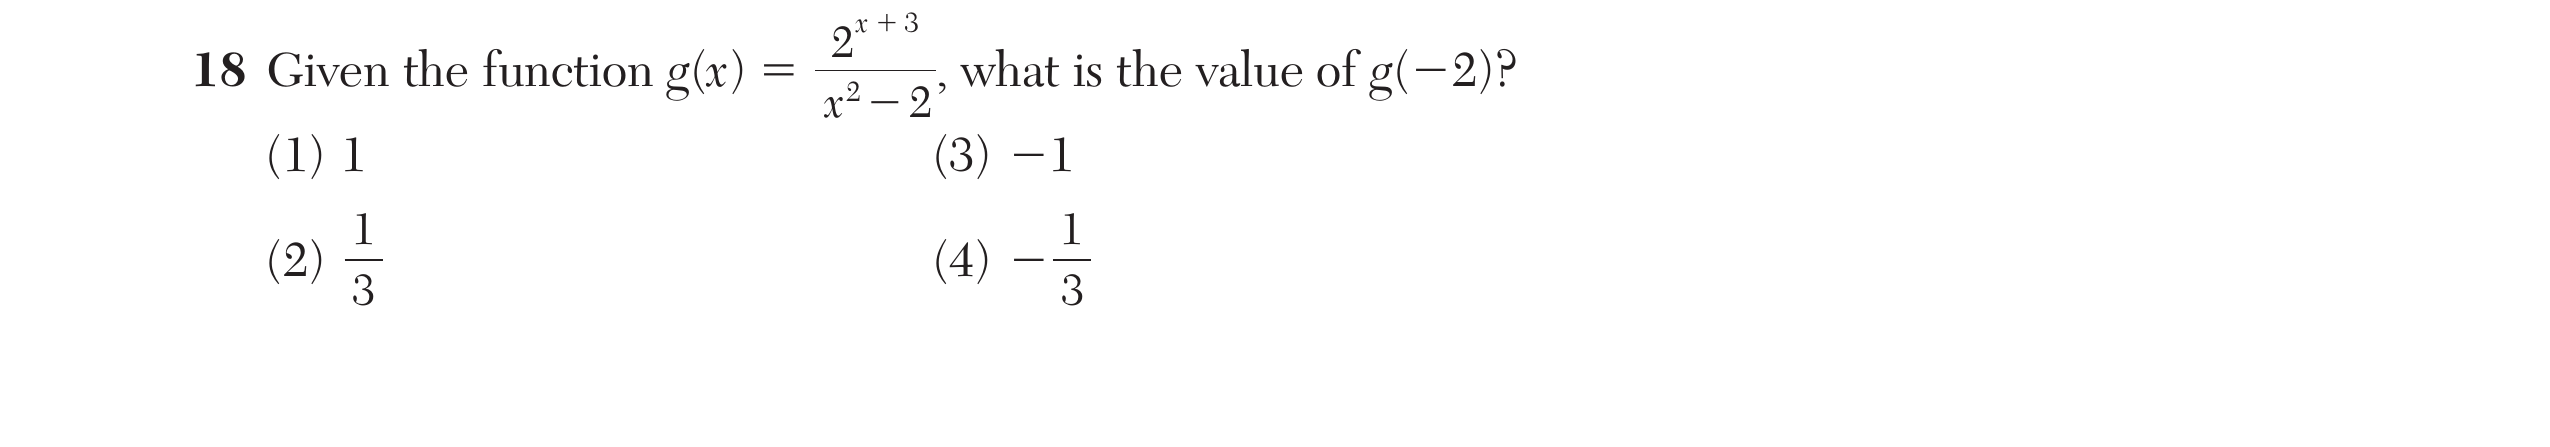
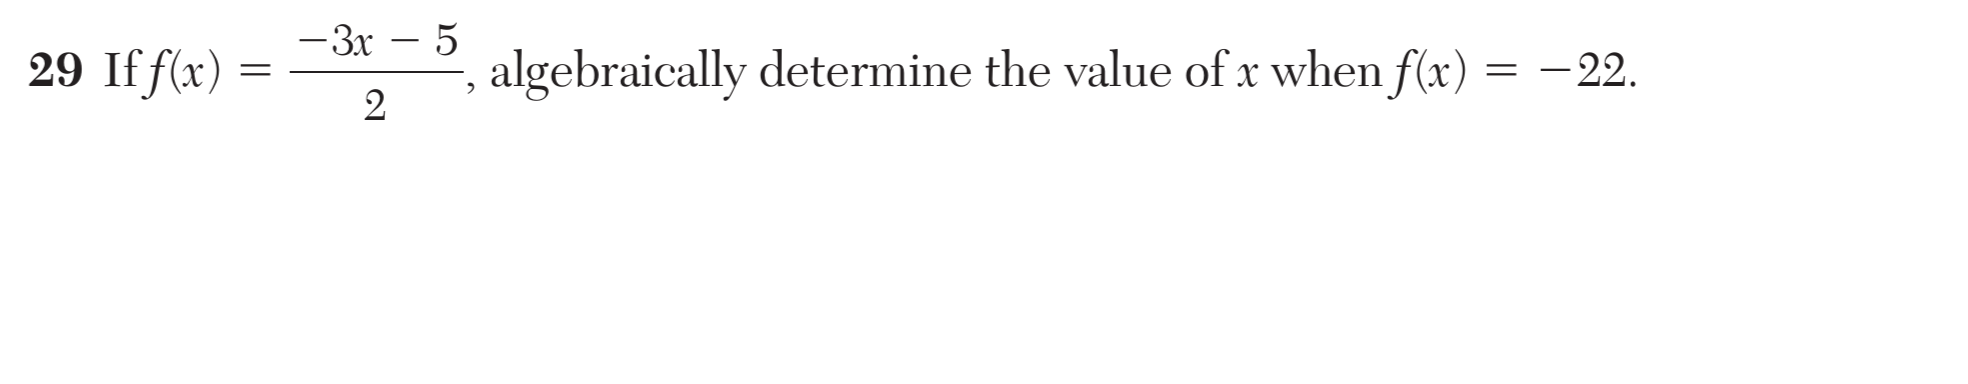
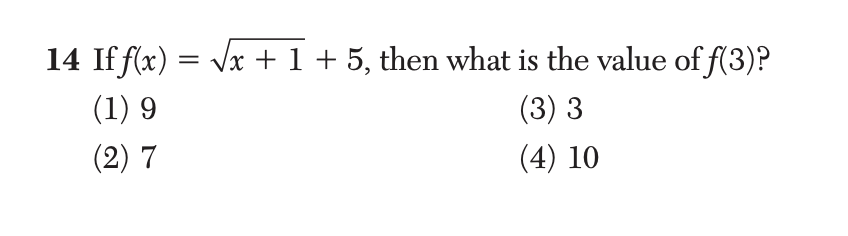
Use function notation, evaluate functions for inputs in their domains, and interpret statements that use function notation in terms of a context.