Building Quadratic Functions to Describe Situations (Part 2)
Student Summary
In this lesson, we looked at the height of objects that are launched upward and then come back down because of gravity.
An object is thrown upward from a height of 5 feet with a velocity of 60 feet per second. Its height, h(t), in feet, after t seconds is modeled by the function h(t)=5+60t−16t2.
- The linear expression 5+60t represents the height that the object would have at time t if there were no gravity. The object would keep going up at the same speed at which it was thrown. The graph would be a line with a slope of 60, which relates to the constant speed of 60 feet per second.
- The expression -16t2 represents the effect of gravity, which eventually causes the object to slow down, stop, and start falling back again.
Notice the graph intersects the vertical axis at 5, which means that the object was thrown into the air from 5 feet off the ground. The graph indicates that the object reaches its peak height of about 60 feet after a little less than 2 seconds. That peak is the point on the graph where the function reaches a maximum value. At that point, the curve changes direction, and the output of the function changes from increasing to decreasing. We call that point the vertex of the graph.
Here is the graph of h.
The graph representing any quadratic function is a special kind of “U” shape called a parabola. You will learn more about the geometry of parabolas in a future course. Every parabola has a vertex, because there is a point at which it changes direction—from increasing to decreasing, or the other way around.
The object hits the ground a little before 4 seconds. That time corresponds to the horizontal intercept of the graph. An input value that produces an output of 0 is called a zero of the function. A zero of function h is approximately 3.8, because h(3.8)≈0.
In this situation, input values less than 0 seconds or more than about 3.8 seconds would not be meaningful, so an appropriate domain for this function would include all values of t between 0 and about 3.8.
Visual / Anchor Chart

Standards
F-BF.11 question
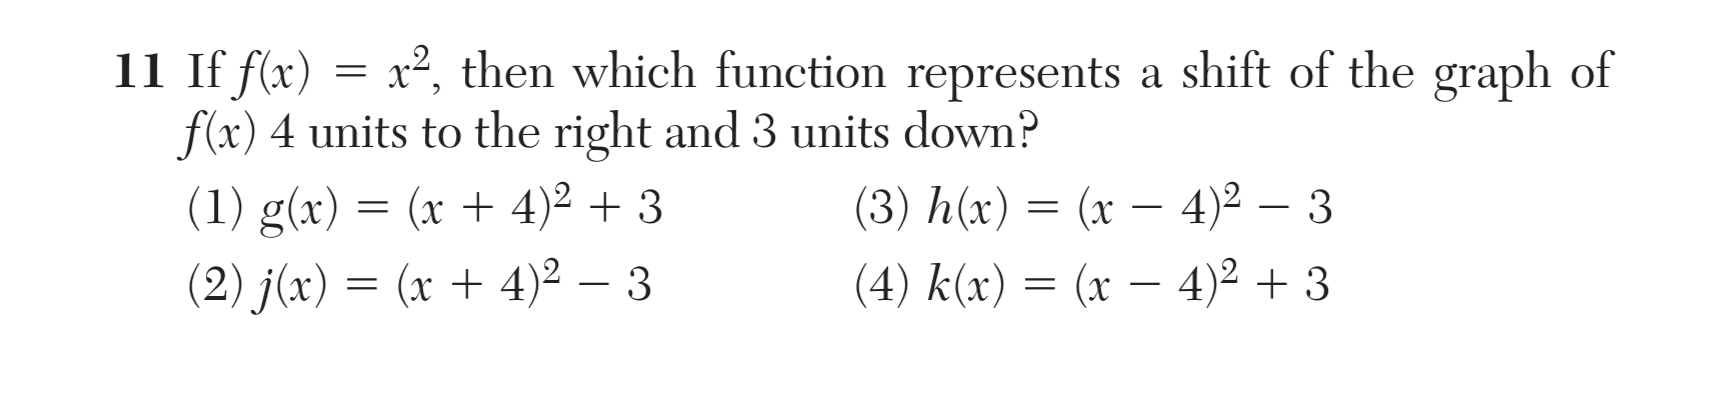
Write a function that describes a relationship between two quantities.
F-BF.1.a
Write a function that describes a relationship between two quantities.
F-IF.7.a
Graph functions and show key features of the graph by hand and by using technology where appropriate.
F-LE.6
No additional information available.
F-IF.52 questions
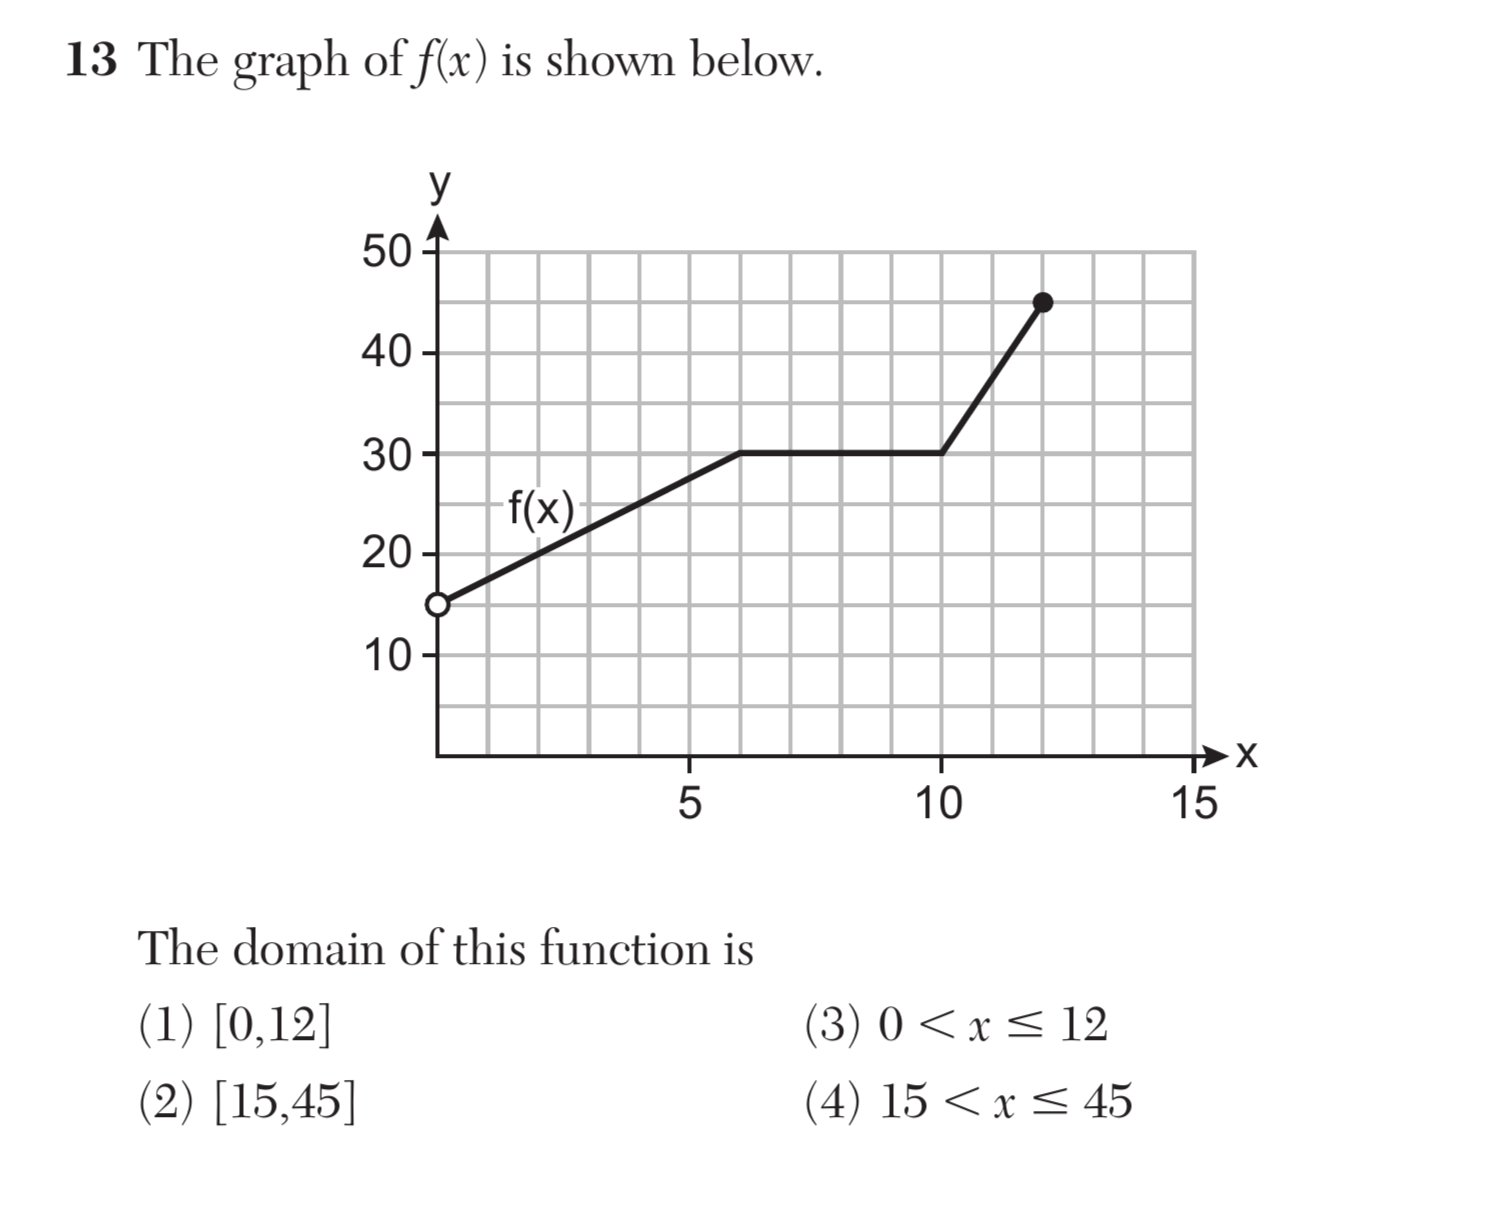
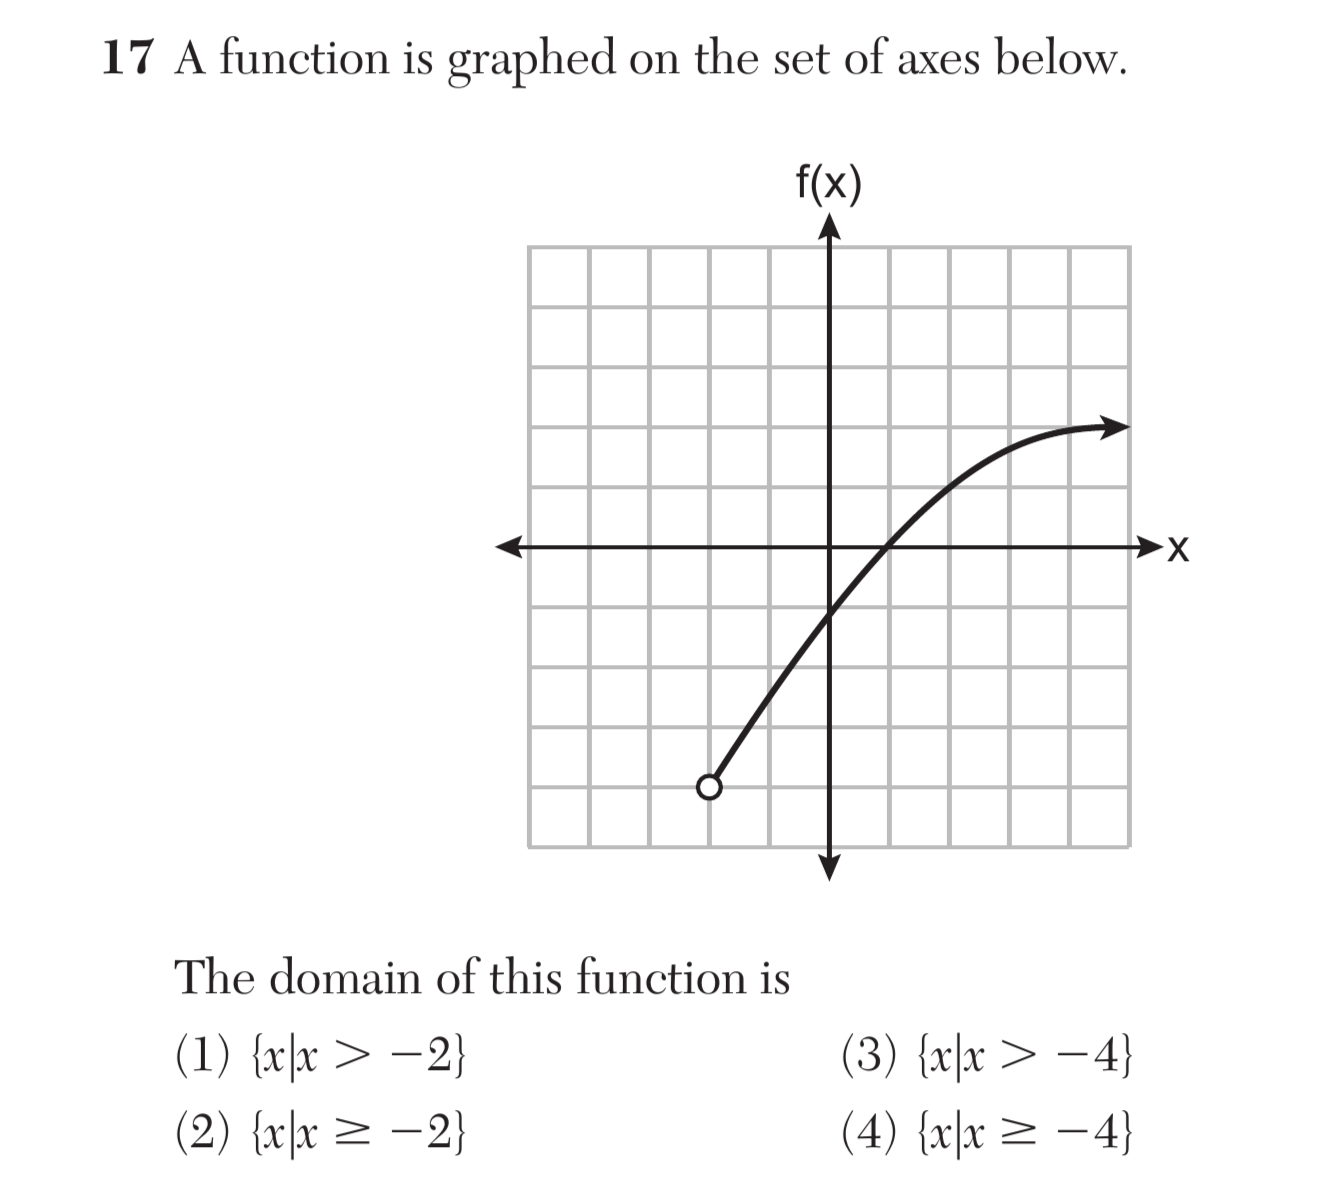
Determine the domain of a function from its graph and, where applicable, identify the appropriate domain for a function in context.