Graphing the Standard Form (Part 1)
Student Summary
Remember that the graph representing any quadratic function is a shape called a parabola. People often say that a parabola “opens upward” when the lowest point on the graph is the vertex (where the graph changes direction), and “opens downward” when the highest point on the graph is the vertex. Each coefficient in a quadratic expression written in standard form ax2+bx+c tells us something important about the graph that represents it.
The graph of y=x2 is a parabola opening upward with vertex at (0,0). Adding a constant term 5 gives y=x2+5 and raises the graph by 5 units. Subtracting 4 from x2 gives y=x2−4 and moves the graph 4 units down.
| x | -3 | -2 | -1 | 0 | 1 | 2 | 3 |
|---|---|---|---|---|---|---|---|
| x2 | 9 | 4 | 1 | 0 | 1 | 4 | 9 |
| x2+5 | 14 | 9 | 6 | 5 | 6 | 9 | 14 |
| x2−4 | 5 | 0 | -3 | -4 | -3 | 0 | 5 |
A table of values can help us see that adding 5 to x2 increases all the output values of y=x2 by 5, which explains why the graph moves up 5 units. Subtracting 4 from x2 decreases all the output values of y=x2 by 4, which explains why the graph shifts down by 4 units.
In general, the constant term of a quadratic expression in standard form influences the vertical position of the graph. An expression with no constant term (such as x2 or x2+9x) means that the constant term is 0, so the y-intercept of the graph is on the x-axis. It’s not shifted up or down relative to the x-axis.
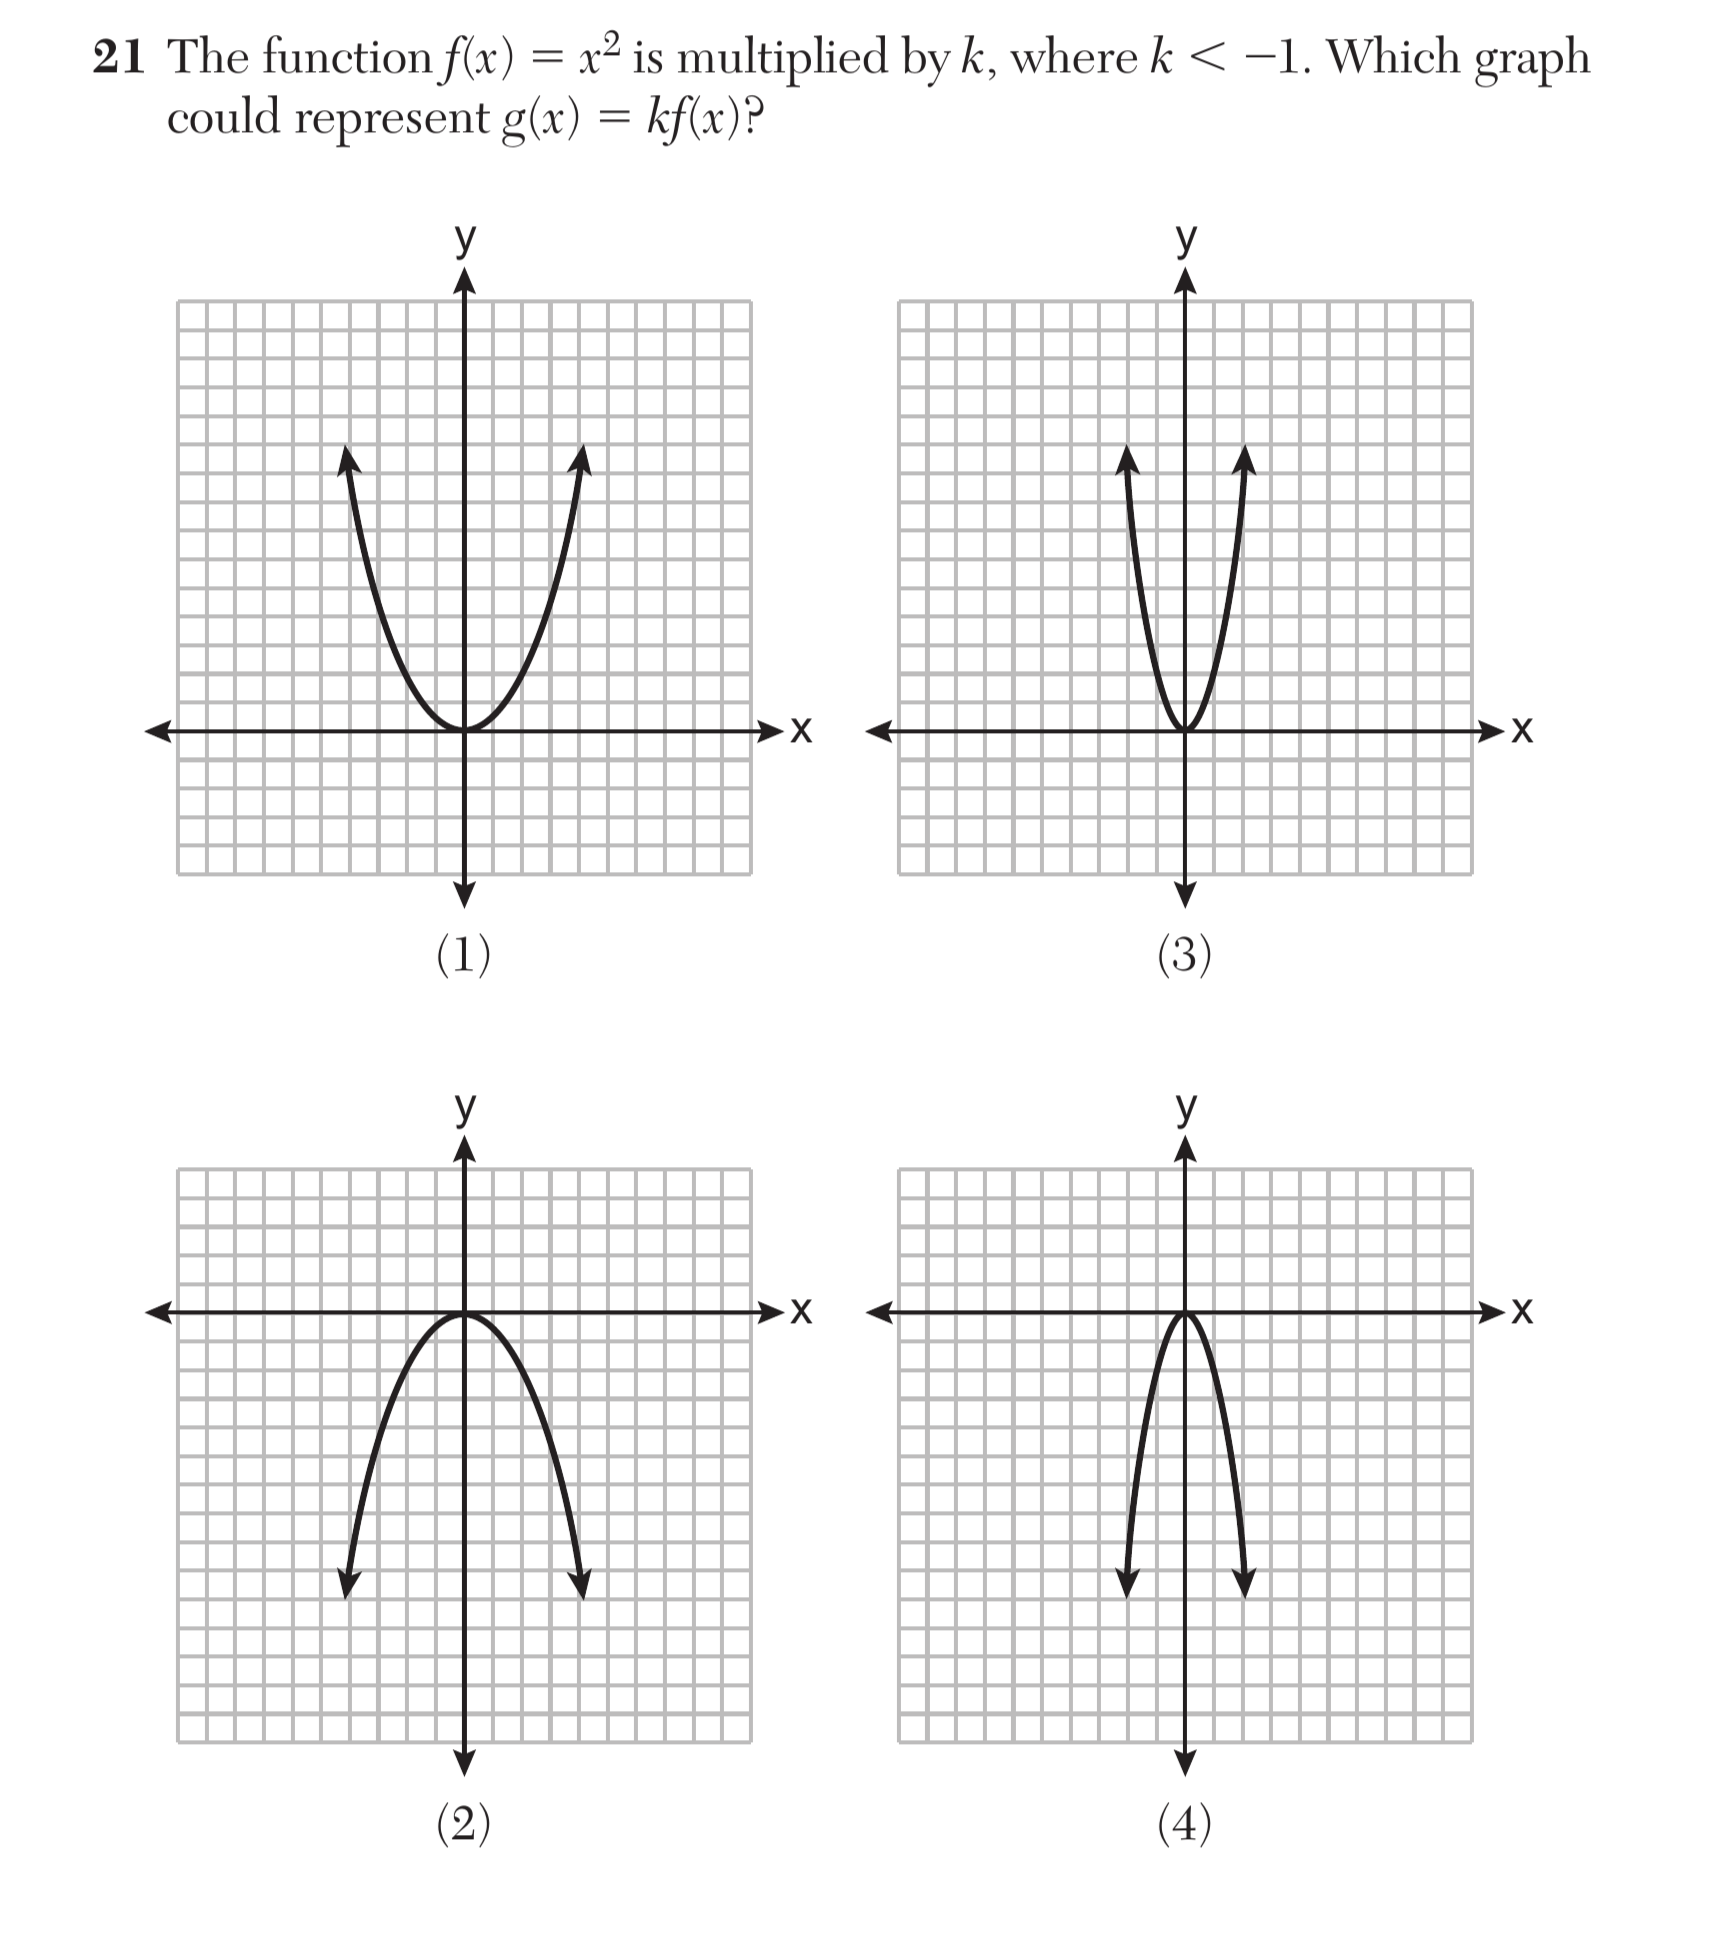
The coefficient of the squared term in a quadratic function also tells us something about its graph. The coefficient of the squared term in y=x2 is 1. Its graph is a parabola that opens upward.
- Multiplying x2 by a number greater than 1 makes the graph steeper, so the parabola is narrower than that representing x2.
- Multiplying x2 by a number less than 1 but greater than 0 makes the graph less steep, so the parabola is wider than that representing x2.
- Multiplying x2 by a number less than 0 makes the parabola open downward.
| x | -3 | -2 | -1 | 0 | 1 | 2 | 3 |
|---|---|---|---|---|---|---|---|
| x2 | 9 | 4 | 1 | 0 | 1 | 4 | 9 |
| 2x2 | 18 | 8 | 2 | 0 | 2 | 8 | 18 |
| -2x2 | -18 | -8 | -2 | 0 | -2 | -8 | -18 |
If we compare the output values of 2x2 and -2x2, we see that they are opposites, which suggests that one graph would be a reflection of the other across the x-axis.
Visual / Anchor Chart

Standards
F-LE.21 question
F-BF.31 question
F-IF.75 questions
Graph functions and show key features of the graph by hand and by using technology where appropriate.
F-IF.C
No additional information available.